Your Capital Deserves
An Operating System,Not Another Fund.
PE compresses returns while charging 2&20. Real estate is rate-dependent. Public markets are correlated. We build your family office 100%-owned, AI-native e-commerce brands that generate uncorrelated cash flows and hand you the keys.
No asset-based fees. No black-box reporting. We are paid from profit and realisations, and the complete fee structure is published on this site before you speak to anyone.
↑ Private Briefing. Watch Before Requesting Access
Market size: Statista, eMarketer. PE comparison: Preqin Global PE Report. Fee and ownership terms: see Capital Model. Exit multiples: see Due Diligence.
You Are Paying Premium Fees For Compressed Returns.
The family office playbook hasn't evolved in 30 years. Meanwhile, PE returns are compressing, lock-ups are lengthening, and the denominator effect is destroying your allocation flexibility. The data is unambiguous.
of Family Offices report dissatisfaction with PE/VC transparency
Average PE fund IRR in 2024, down from 18% a decade ago
Average PE lock-up destroying your capital optionality
of Family Offices are increasing direct investment allocations in 2026
Traditional PE vs GlobalBrands.ai
The greatest threat to a Family Office isn't market volatility. It's the compounding cost of misaligned incentives and intellectual stagnation.
E-Commerce Is the New Private Equity.Without the Middlemen.
The e-commerce market is approaching $8.1 trillion by 2026. AI has permanently lowered the cost of building, scaling, and exiting consumer brands. This is the single greatest uncorrelated asset class available to family offices today.
The AI Advantage: By the Numbers
We Build Across All Three Pillars
Where Traditional Models Fail You
We have identified 8 critical structural failures in the current Family Office playbook. Our platform was engineered to solve every single one.
The AI-Powered Operating Partner
We are not a fund. We are a technology-powered operating system. This distinction is critical, and it changes everything about how your capital compounds.
Not a Fund
A fund pools capital and relies on discretionary judgment. Our operating system uses a repeatable, scalable, data-driven process to produce predictable outcomes, eliminating the human variability problem entirely.
The Digital Factory
We don't produce abstract financial returns; we manufacture tangible, 100%-owned, cash-flowing brands on your behalf. Every brand is a precision-engineered asset with a compounding revenue architecture.
The Stack
Our proprietary AI stack handles every stage of the manufacturing process, from market analysis and brand creation to supply chain automation. This disintermediates the traditional fund structure entirely.
The Core Promise
This is the synthesis of the model. It resolves the central paradox that paralyzes modern family office investing: you can either have control or you can have ease, but not both. We give you both.
Learn how it worksThe 10 Core Mandates Solved
Every structural challenge facing modern Family Offices. Mapped, categorised, and solved.
The Fee Dilemma
Problem: 2 & 20 on assets
Solution: No fee on your capital. We are paid from profit and realisations, disclosed in full upfront.
The Execution Dilemma
Problem: High Operational Burden
Solution: "Done-For-You" Factory Model. 0% Burden.
The Generational Mandate
Problem: Low Yields
Solution: 20–30% Target IRR. Technology-forward for NextGen.
The Thematic Imperative
Problem: Speculative AI
Solution: "Applied AI" (Picks & Shovels). Real cash flow, not hype.
The Legacy Mandate
Problem: Passive Custody
Solution: Become "Business Builders" again. Direct ownership of brands.
The Operational Mandate
Problem: Data Complexity
Solution: Centralized, AI-powered infrastructure. Institutional execution.
The Governance Mandate
Problem: Opaque Reporting
Solution: Radical Transparency. Real-time per-asset dashboards.
The Diversification Mandate
Problem: High Correlation
Solution: New Asset Class. Low correlation to public markets.
The Resilience Mandate
Problem: Supply Shock
Solution: AI-driven agility. Redundant, non-China supply chains.
The Liquidity & Exit Dilemma
Problem: 10-Year Lockups
Solution: Flexible 36–60 month horizons. You control the exit strategy.
Flywheel 2.0
We have engineered the next generation of the Capital Flywheel. A system that transforms Intelligence into Compounding Growth.
A Smart System
We do not guess. Traditional VC is gambling. We use AI to analyze billions of data points to find what customers already want, before committing a single dollar.
- Identifying Product-Market Fit
- Cloning Proven Winners
- Zero-Risk Validation
Compounding Value
The Snowball Effect. We use a proprietary "Playbook" where profits are reinvested back into the business tax-efficiently, creating a compounding flywheel.
- Profit → Reinvestment → Growth
- Tax-Deferred Compounding
- Cross-Brand Data Synergies
AI Efficiencies
Speed = Value. AI manages the supply chain, designs the creative, and optimizes ads in real-time. This makes the process 10x faster and 70% cheaper than traditional methods.
- Auto-Creative Generation
- Supply Chain Prediction
- Dynamic Pricing Models
The "Compounding Growth" Playbook
We prioritize long-term Enterprise Value over short-term profit taking. Reinvestment, technological dominance, and tax-efficient compounding.
Acquisition costs rise, one or more brands fail to reach profitability, exit multiples stay compressed. Capital is returned slowly or partially.
Most brands reach profitability on schedule, one materially outperforms, exits clear at the lower end of current market multiples.
Validation converts at expected rates, contribution margin holds as spend scales, and at least one brand exits at a premium multiple.
A target is an objective, not a projection and not a guarantee. For context, average family office return expectations fell from roughly 11% in 2024 to around 5% for 2025, and a meaningful minority now expect a negative outcome. Any target well above that range deserves harder scrutiny, not less. Ask us for the full sensitivity model and read the Risk Disclosure before relying on any figure here.
Systematic Reinvestment
Profits from Brand A become the seed capital for Brand B. This creates a virtuous, self-funding cycle of geometric growth.
Geometric Growth
An arithmetically growing portfolio adds value. A geometrically compounding portfolio multiplies it. The difference is exponential.
Enterprise Value Capture
We prioritize long-term EV over short-term profit taking, building assets that command premium exit multiples at sale.
The Model Speaks for Itself
"The Digital Annuity is the first instrument that gives Family Offices the returns of Venture Capital, the control of Real Estate, and the predictability of Bonds, simultaneously."
Engineering Durable Enterprise Value.
We do not build "cash grab" stores. We build institutional-grade data assets. By owning the customer relationship and supply chain data, we create a defensive moat that creates value far beyond simple cash flow.
The Data Moat
Every interaction feeds our proprietary "Knowledge Graph." As the portfolio grows, customer acquisition costs drop and retention rises. An algorithmic advantage traditional PE cannot replicate.
Sticky, Recurring Relationships
We transform transactional buyers into brand loyalists. With a 92% retention rate strategy, revenue quality shifts from "one-off" to "quasi-subscription," commanding higher exit multiples.
Institutional Infrastructure
Real-time dashboards, AI-managed operations, and continuous optimization. Your capital is backed by infrastructure that most institutional managers can only dream of.
Performance Attribution
YTD 2024Your Portfolio, Visible 24 / 7 / 365.
No more waiting for quarterly PDFs. As a GlobalBrands.ai partner you receive immediate access to a live client dashboard with 9 pages of real-time intelligence covering every metric that matters.
↑ Live Client Dashboard. Actual UI. Updated in Real-Time
Everything Your Family Office Needs to Know
Real-Time Portfolio Tracking
24/7 live data across all 10 brands. Revenue, ad spend, margins, ROAS, CAC, LTV. Updated continuously.
Conversion Funnel Intelligence
Session → ATC → Checkout → Purchase tracking per brand. Drop-off analysis and cost-per-stage metrics.
Multi-Platform Analytics
Shopify, TikTok Shop, and Amazon revenue broken down side-by-side. Platform efficiency at a glance.
Capital Deployment Tracker
Visualise exactly how your capital is staged, deployed, and compounding across every brand in real-time.
Client-Grade Financials
P&L, margin trends, ad spend vs revenue. All in one view. Built for family office reporting standards.
Automated Report Generation
Monthly memos, quarterly summaries, and exit analysis. Downloadable in one click. No more PDF hunting.
See the Actual Dashboard Now
Click through to the full Client Portal and explore all 9 sections: Overview, Brands, Funnel, Performance, Channels, Financials, Capital, Operations, and Reports.
The "Digital Annuity"
A new hybrid instrument engineered for the post-interest rate era. It combines the Safety of Bonds, the Tax Benefits of Real Estate, and the Upside of Venture Capital.
Cash Flow Native
Unlike VC which relies on a theoretical exit event, these assets produce monthly free cash flow from Day 1.
Inflation Hedge
Digital goods have near-zero marginal cost. We adjust pricing in real-time to outpace CPI inflation.
Tax Efficiency
Reinvesting profits into inventory and ad-spend is fully tax-deductible, allowing for tax-deferred compounding.
Sovereign Control
You are not a passenger in a fund. You own the IP, the data, and the bank account. Total sovereignty.
We Know What This Sounds Like.
Say “e-commerce brands, AI-native, target IRR” in an investment committee and two comparisons arrive before you finish the sentence. Both are legitimate reference points. Here is where we genuinely differ, and where we do not.
Raised roughly $16B, much of it debt, to acquire existing Amazon sellers at speed and consolidate them.
Widespread distress and restructuring. Thrasio filed Chapter 11 in February 2024 after burning about $3.4B, despite backing from major institutional investors.
Sell prebuilt storefronts and AI-powered automation to individuals, typically for fees between $2,000 and $35,000, with promises of passive income.
At least four operators shut down by the FTC in the last two years, with bans and multi-million-dollar restitution orders. This is the category our vocabulary can be mistaken for, so we name it.
Capital is deployed into building new brands on validated demand. The client holds 100% of the equity in a company registered in their name.
No realised exit from a brand we built has yet occurred. That is the honest position, and it is the most important limitation on this page.
Established operators such as WebStreet run a Micro PE model, raising capital to buy and operate existing online businesses, with public case studies and open FAQs. It is a real, working structure and a fair comparable. The difference is direction: they buy cash-flowing businesses and optimise them; we build new ones against validated demand. Buying gives you revenue on day one and an acquisition price to earn back. Building gives you no revenue on day one and no price to earn back. Neither is strictly better, and which suits you depends on whether you are underwriting operator skill or entry multiple.
- We have not yet completed a realised exit from a brand we built. Our evidence is operating performance, not exit performance.
- The billion-dollar brands cited elsewhere on this site are third-party companies. We did not build, fund, or operate any of them.
- Target returns are objectives derived from a model, not results. Family office return expectations fell sharply between 2024 and 2025, and ours should be tested against that backdrop.
- Structural differences reduce the specific failure modes above. They do not remove category risk.
Aggregator failure analysis drawn from RollUpEurope, Hahnbeck M&A, and public reporting on Thrasio’s Chapter 11 filing. Enforcement actions referenced are matters of public record published by the US Federal Trade Commission.
Everything You Need to Know.
Transparent answers to the questions investors ask most.
You own 100%. Brand, stores (Shopify, TikTok Shop, Amazon), trademarks, bank accounts. All under your name. We are your operational partner.
Service fee (paid to us for execution) + Business expenses (paid directly by you: inventory, marketing, logistics). No third-party company holds your investment.
The brand and store, all inventory and supply chain, all revenue and profits, digital and marketing assets, business registration and bank accounts. 100% yours.
You have full control. We provide detailed P&L statements, cash flow analysis, and financial reporting. You handle tax filing (we guide on best practices).
Projections are built bottom-up from operating data across the accounts we run: customer acquisition cost, conversion rate, average order value, contribution margin, and working-capital cycle, then applied to a launch curve. They are a model, not a forecast of your outcome. Every input can move against us, and the same model run with a higher acquisition cost or a lower exit multiple produces materially worse results. Ask us for the sensitivity table rather than the headline number, and read the Risk Disclosure before relying on any figure on this site.
Brokered marketplaces such as Empire Flippers and Quiet Light typically list e-commerce businesses in a 25 to 45x monthly profit band, roughly 2 to 4x yearly EBITDA. Two caveats matter. Listing multiples are asking prices, not completed transactions, so ask a broker for closed comparables in the relevant category and size band. And aggregator demand has contracted materially since 2021, which has pulled realised multiples down. A brand may sell well below this band, or not sell at all.
$100K per brand, $1M recommended (10 brands). Staged deployment: $15K testing → $15-17K launch → remainder as scaling buffer. Revenue starts by Month 3.
200+ clients since 2019. 50-70 new brand launches from scratch. Remaining were existing brands we optimized and scaled.
Yes. Our model is open to family offices and wealth managers in the United States, United Kingdom, and UAE. We never take custody of your capital: you register and own your own entity in your own jurisdiction, and we operate the brand as your services provider. All figures on this site are in USD unless stated otherwise.
Real Results. Built By Our Team.
Below are verified Amazon portfolio results from active client accounts managed by our team, alongside the billion-dollar brand blueprints that define how we build and scale every brand.
Every brand we build follows the same operating framework: validated demand, AI-native execution, full client ownership, and a clear exit path.
We Don't Invent. We Clone Proven Winners.
The Samwer Brothers (Oliver, Marc and Alexander) built a $3B+ empire (Rocket Internet) without inventing a single product. Their method: identify a proven US digital business, clone the model with surgical precision, execute faster in new markets.
They cloned eBay → Alando (sold to eBay for $43M in 100 days). They cloned Airbnb → Wimdu. They cloned Zappos → Zalando (IPO'd at €5.7B). Not by being smarter. By being methodical.
"We are not inventors. We are engineers of proven models."
The Rocket Internet Philosophy
AI-Validated Demand
Before a single dollar is spent, our AI stack analyses search volume, competitor ROAS, margin profiles, and customer LTV across 40+ data points. We only launch what the market already wants.
Clone Proven Brand Architectures
We reverse-engineer the top 1% of e-commerce brands: their positioning, creative angles, price points, and supply chains. Then rebuild with improvements. Every brand launches from a position of validated strength.
AI Accelerated Execution
Where the Samwers used speed of human execution, we deploy AI. Autonomous ad optimisation, AI copywriting, predictive inventory, and real-time margin management. Years of learning compressed into weeks.
Brands That Changed Everything
The billion-dollar playbooks we study when designing a launch.
Gymshark, MVMT, Beardbrand, and Allbirds are independent third parties. We did not found, fund, operate, or advise any of them, and we hold no interest in any of them. They are cited only as publicly documented examples of what this category has produced. Their outcomes are not our track record and predict nothing about results we can achieve. Our own operating data is in the section below, clearly separated.

Gymshark
From a garage to a billion-dollar empire. In 8 years.
Ben Francis started Gymshark in 2012 from his parents' garage in Birmingham with £1,000 and a screen-printing machine. He identified a gap: the market had no premium fitness apparel that actually fit athletic bodies. Rather than compete on price, he went direct-to-consumer via social media before it was a strategy. By 2020, General Atlantic invested at a £1 billion valuation with no traditional retail stores involved.
DTC via social media + influencer seeding. No retail stores. Pure digital brand velocity.
This is our model applied to apparel. Proven demand + digital-first execution + no legacy overhead = category dominance.

MVMT Watches
No factory. No store. A $300M exit in 4 years.
Jake Kassan and Kramer LaPlante launched MVMT in 2013 with $300,000 raised on Indiegogo. The insight was simple: fashion watches were massively overpriced by retail markups. By cutting out every middleman and selling direct, they offered premium aesthetics at a fraction of the cost. In 2018, Swiss luxury group Movado acquired MVMT for $300M. That is a 1,000x return on founding capital.
Crowdfunding-to-DTC pipeline. Facebook/Instagram as primary acquisition channel. SKU discipline with few, high-converting products.
Proof that a small, focused brand with tight SKUs and paid social can outperform legacy players 100x their size. Our model uses the same playbook, applied digitally.

Beardbrand
Built on YouTube. Profitable from Day 1.
Eric Bandholz launched Beardbrand in 2012 with $30 and a Tumblr blog. He understood that men's grooming had no premium digital-native brand. Using YouTube content marketing before content marketing had a name, he built an audience of 2 million subscribers and converted them into a loyal customer base. The brand was profitable within months and has never taken external capital, generating $7M+ in annual revenue with 80%+ margins on hero SKUs.
YouTube-first content engine. Zero ad spend in Year 1. Organic audience compounding. Subscription revenue for predictable base.
The "annuity" model made real: high-margin consumables + subscription = predictable, growing cash flows. This is what AI-powered brand management replicates at scale.

Allbirds
$50M crowdfunded. $1.4B IPO. One SKU.
Tim Brown and Joey Zwillinger launched Allbirds in 2016 with a radical concept: one shoe, made from wool, designed for simplicity. The entire first campaign was a single Kickstarter raising $120K in four days. By 2021 they IPO'd on NASDAQ at a $1.4 billion valuation. The insight was not sustainability. It was conviction. They believed one great product, marketed with a clear narrative, beats a hundred mediocre ones.
Kickstarter product validation → DTC brand building → retail adjacency. Single hero SKU then SKU expansion from position of strength.
Proof of the product conviction principle. We identify one validated product per brand, builds authority around it, then expands. Exactly this playbook, with AI-accelerated validation.
The Dashboards Behind The Brands We Build.
Live client accounts operated by our team across Amazon, Shopify, and TikTok Shop. Every screenshot below is taken unedited from the platform's own seller dashboard.
These are accounts our team runs, shown at account level and before portfolio-level fees are applied. Figures are platform-reported and are not independently audited unless expressly stated. Client identities are withheld at their request and can be verified under NDA, including by live screen-share rather than exported images. Strong periods are shown here; ask us for the full account list, including the ones that underperformed.
Amazon
7 brandsAccount launches, listing and PPC builds, and full turnarounds on Seller Central.
 Scaling
Portfolio Account 01
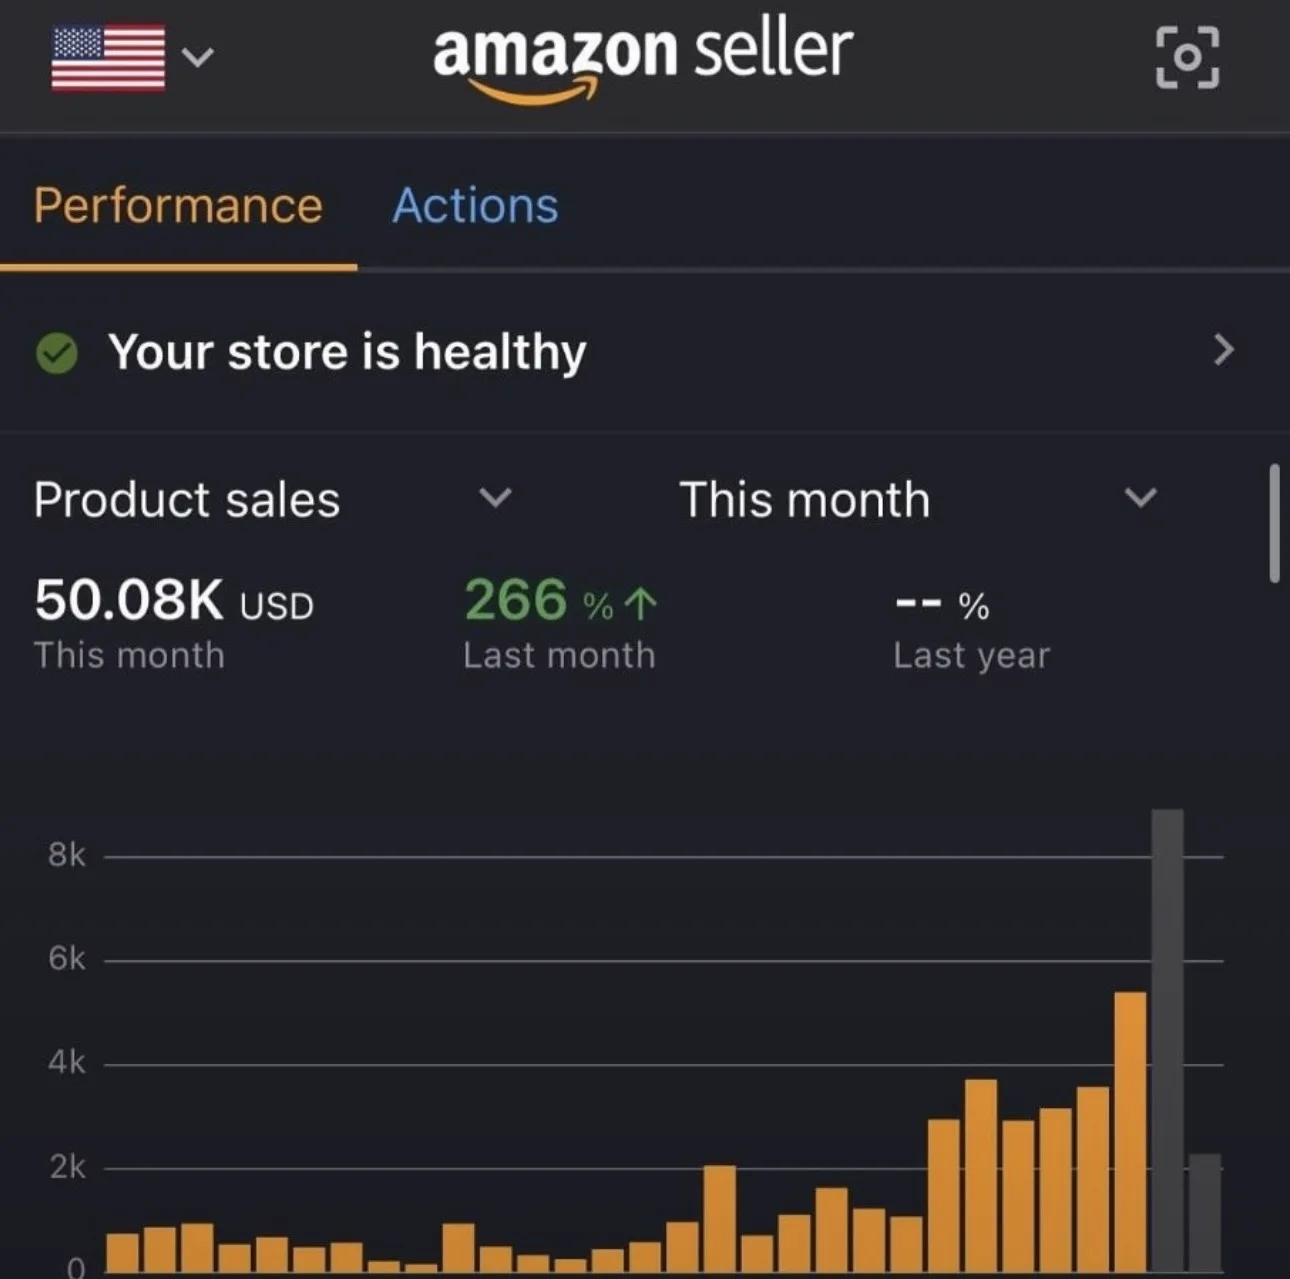
Amazon USARebuilt the PPC structure and listing set on a US Amazon account coming off a slow stretch, prioritising the highest-intent search terms first.
This month's sales already sit at $50.08K, up 266% over last month.
 Scaled
Portfolio Account 02
Amazon USATook a mature Amazon USA account through an aggressive PPC and catalog expansion push to capture demand ahead of peak season.
$543.5K in sales over the last 30 days, up 337% on the prior period and 204% year over year.
 Scaled
Portfolio Account 03
Amazon USAManaged full-funnel advertising and listing optimisation on a consistently performing Amazon USA account, compounding growth month over month.
$150.0K in sales over the last 30 days, up 21% on the prior period and 183% year over year, with 415 units moving on a single day inside the window.
 Scaled
Portfolio Account 04
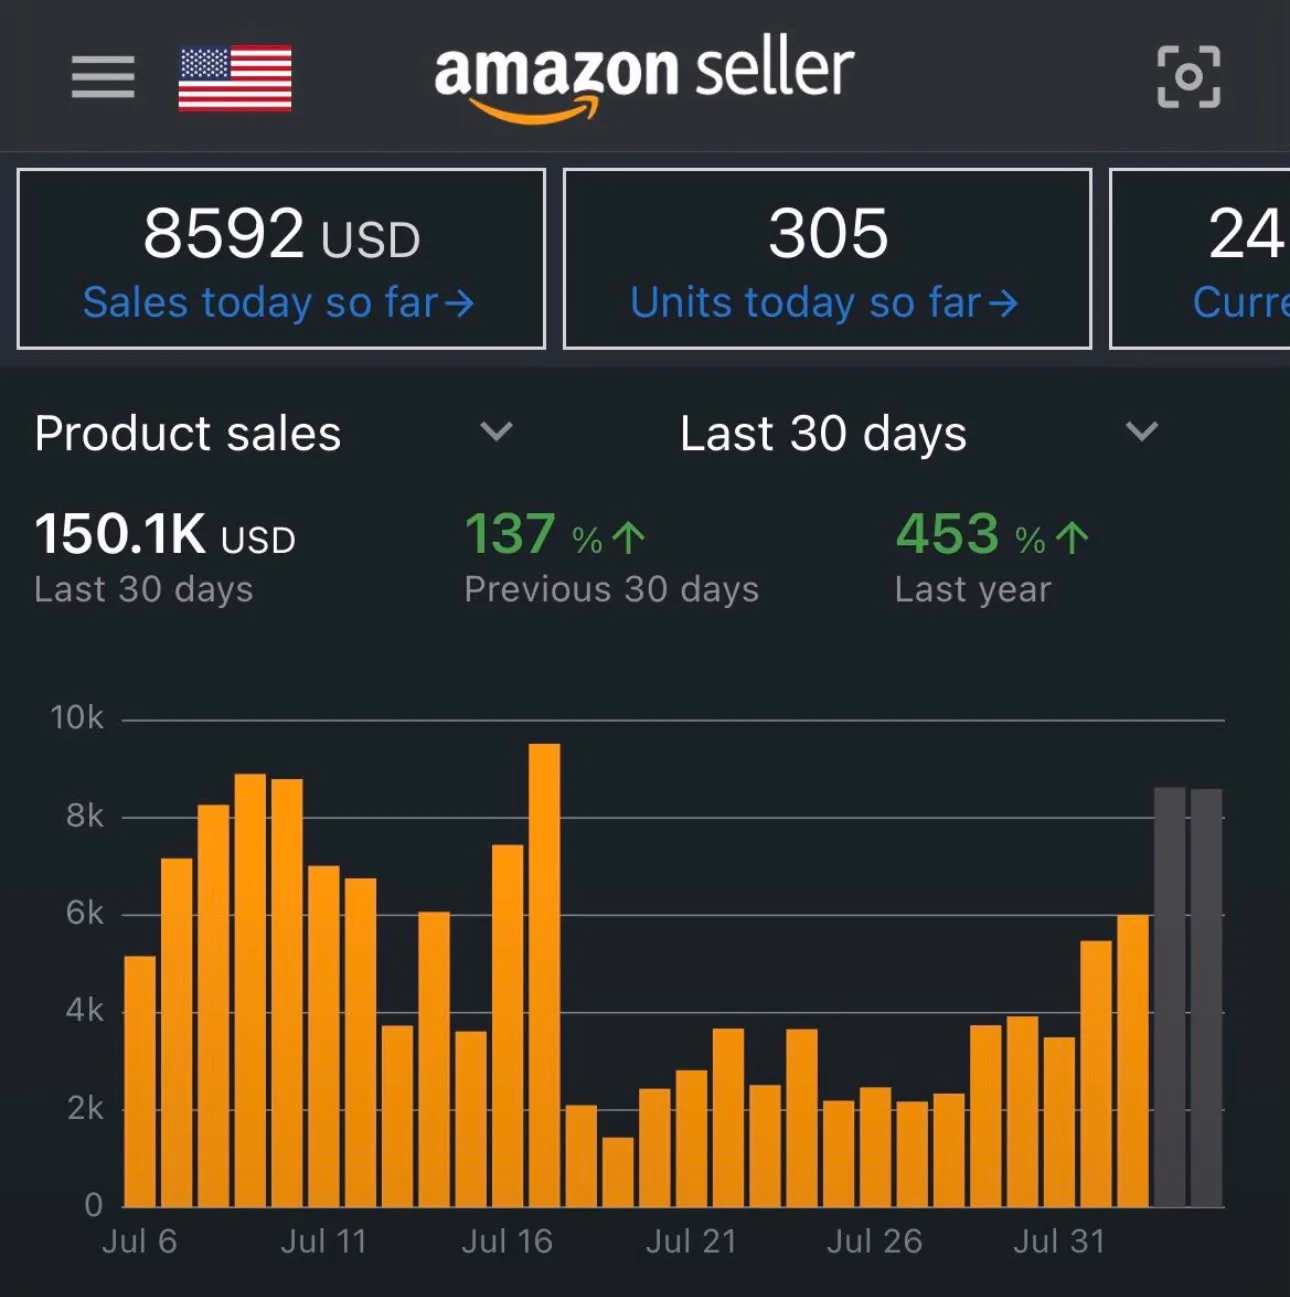
Amazon USARan a summer push across advertising and inventory planning on a US Amazon account, converting seasonal demand into sustained order volume.
$150.1K in sales over the last 30 days, up 137% on the prior period and 453% year over year.
 Scaling
Portfolio Account 05
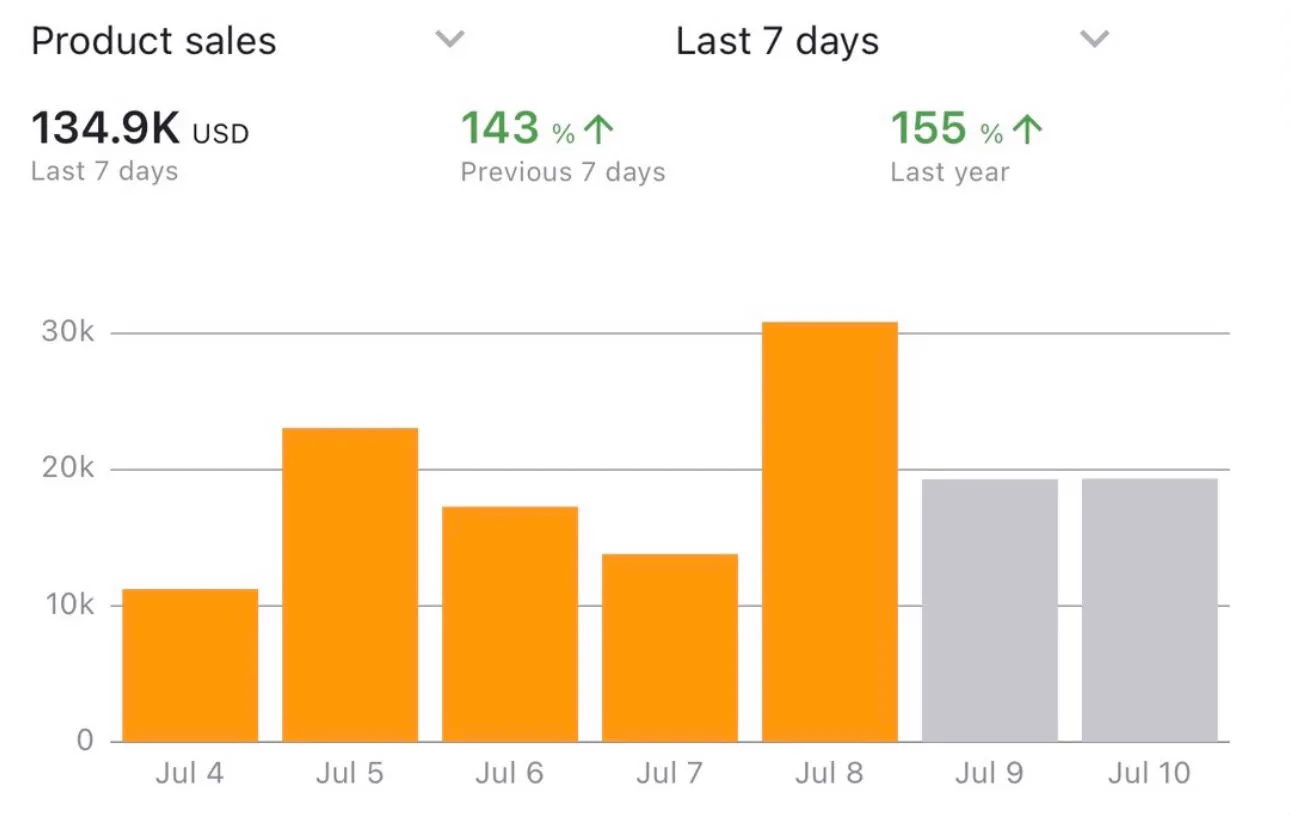
Amazon USACompressed a seasonal advertising push into a single week on this Amazon USA account, timing spend around a proven demand spike.
$134.9K in sales over the last 7 days alone, up 143% week over week and 155% year over year.
 Managed
Portfolio Account 06
Amazon USAHandled full account operations for the month, from order fulfilment through refund management, on an established Amazon USA account.
Closed the month at $174,442 in sales across 3,644 orders, with $109.4K in estimated payout and $29.3K in gross profit after refunds.
 Scaled
Portfolio Account 07
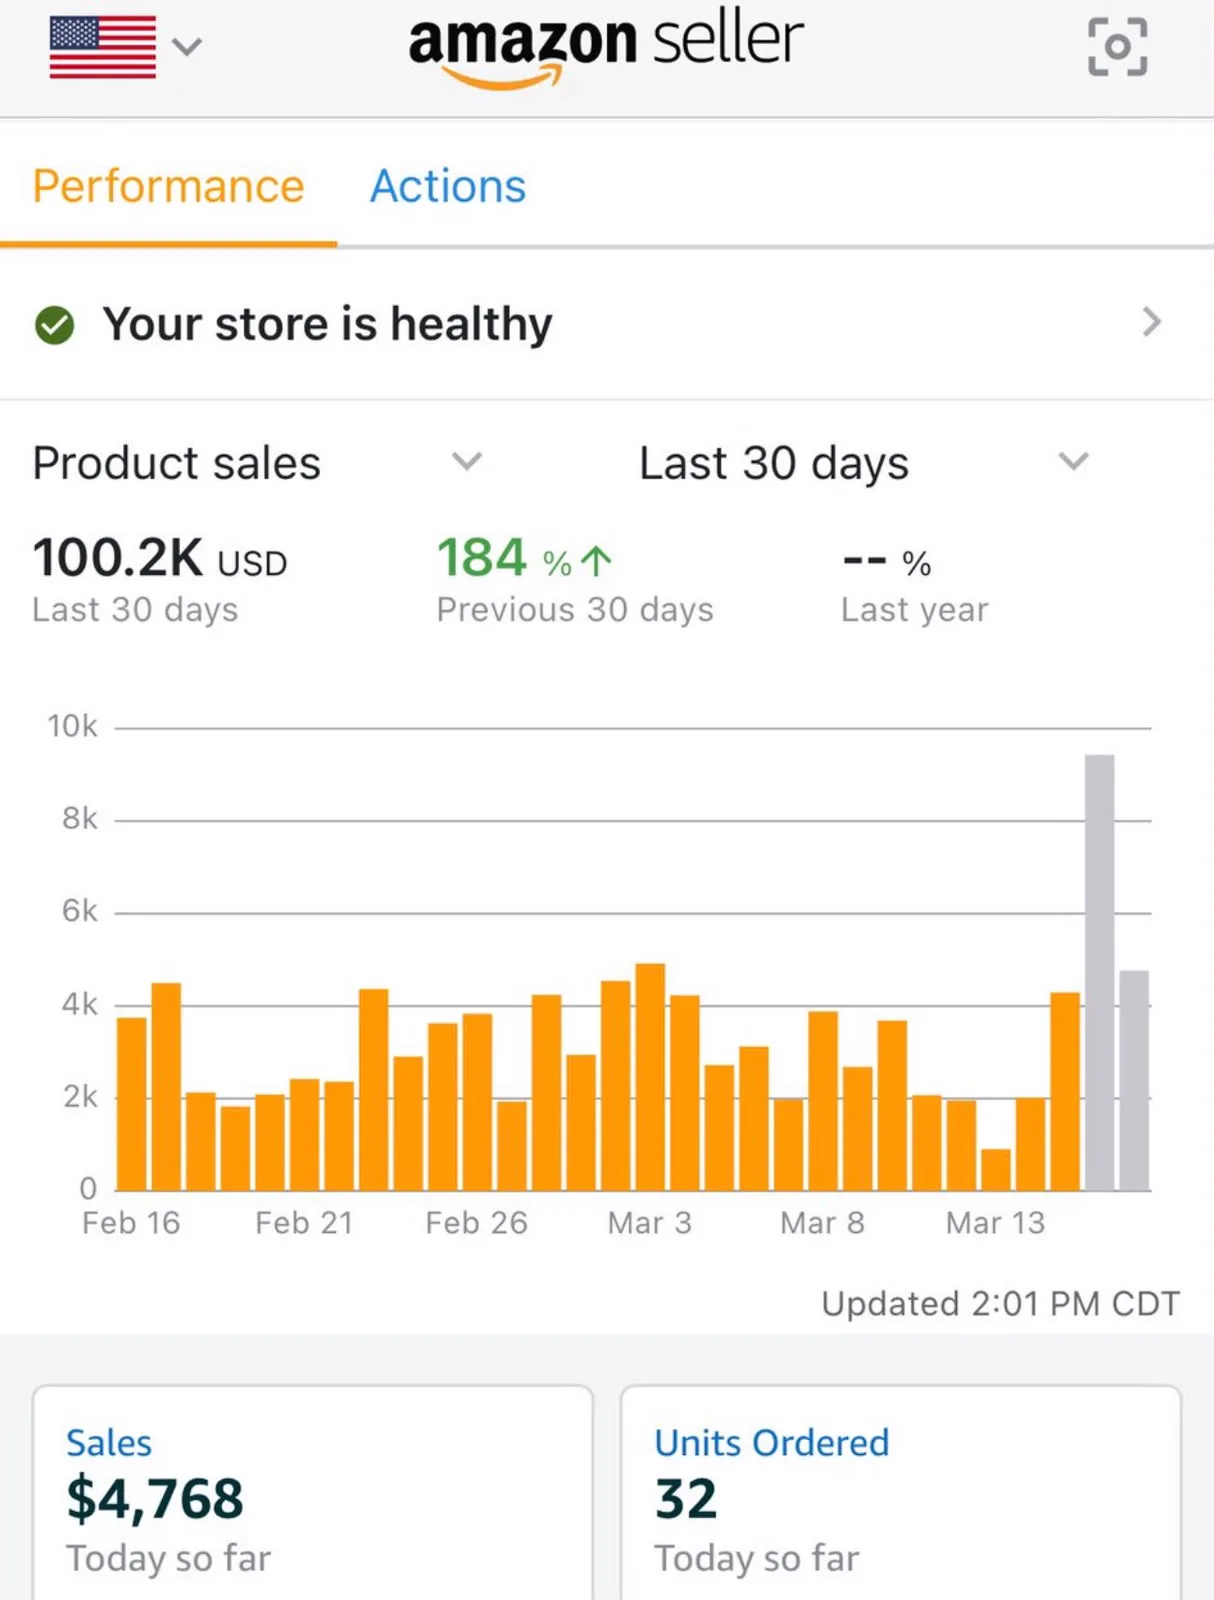
Amazon USARebuilt advertising structure and pricing strategy on this Amazon USA account, holding a healthy store status while scaling spend.
$100.2K in sales over the last 30 days, up 184% on the prior period, with $4,768 in sales and 32 units ordered today alone.
Shopify
8 brandsDirect to consumer stores built and scaled with paid social, email, and conversion work.
 Launched
Shopify Portfolio 01
DTC LaunchLaunched on the same test, validate, and launch model we run every store on, going live and crossing its first 10 orders inside the first stretch.
kr13,109 in sales yesterday alone, up 56% day over day with orders up 37%, now scaling under client ownership.
 Scaled
Shopify Portfolio 02
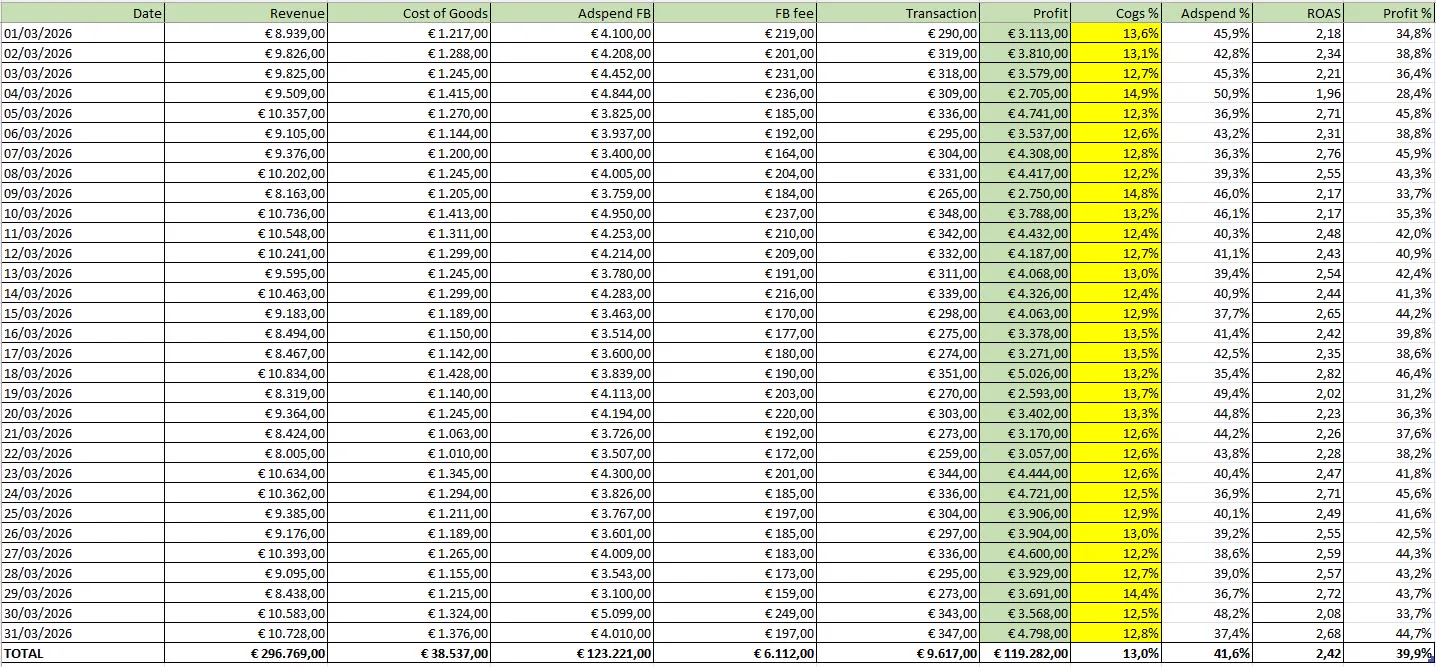
DTC ScaledValidated the offer, then scaled paid social spend month over month once margins held, using the same test, validate, and launch model across every brand we build.
€296,769 in revenue for the month with €119,282 in profit at a 39.9% margin and a 2.42x return on ad spend, now scaling under client ownership.
 Launched
Shopify Portfolio 03
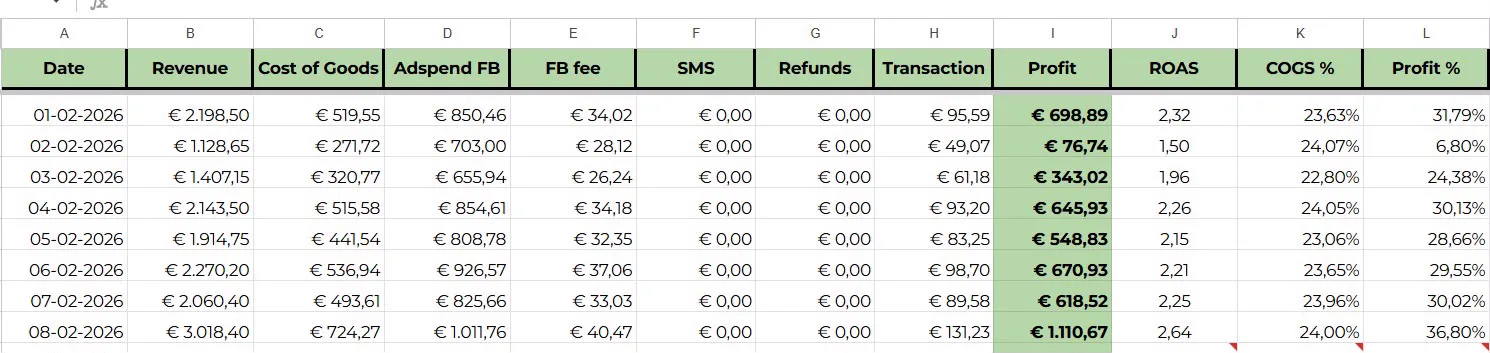
DTC LaunchEarly-stage launch under the same test, validate, and launch model, tracking daily profit and ROAS from day one to confirm the offer before scaling spend.
Already profitable within the first week, holding a 2.64x ROAS and 24%+ margins by day 8, now scaling under client ownership.
 Scaled
Shopify Portfolio 04
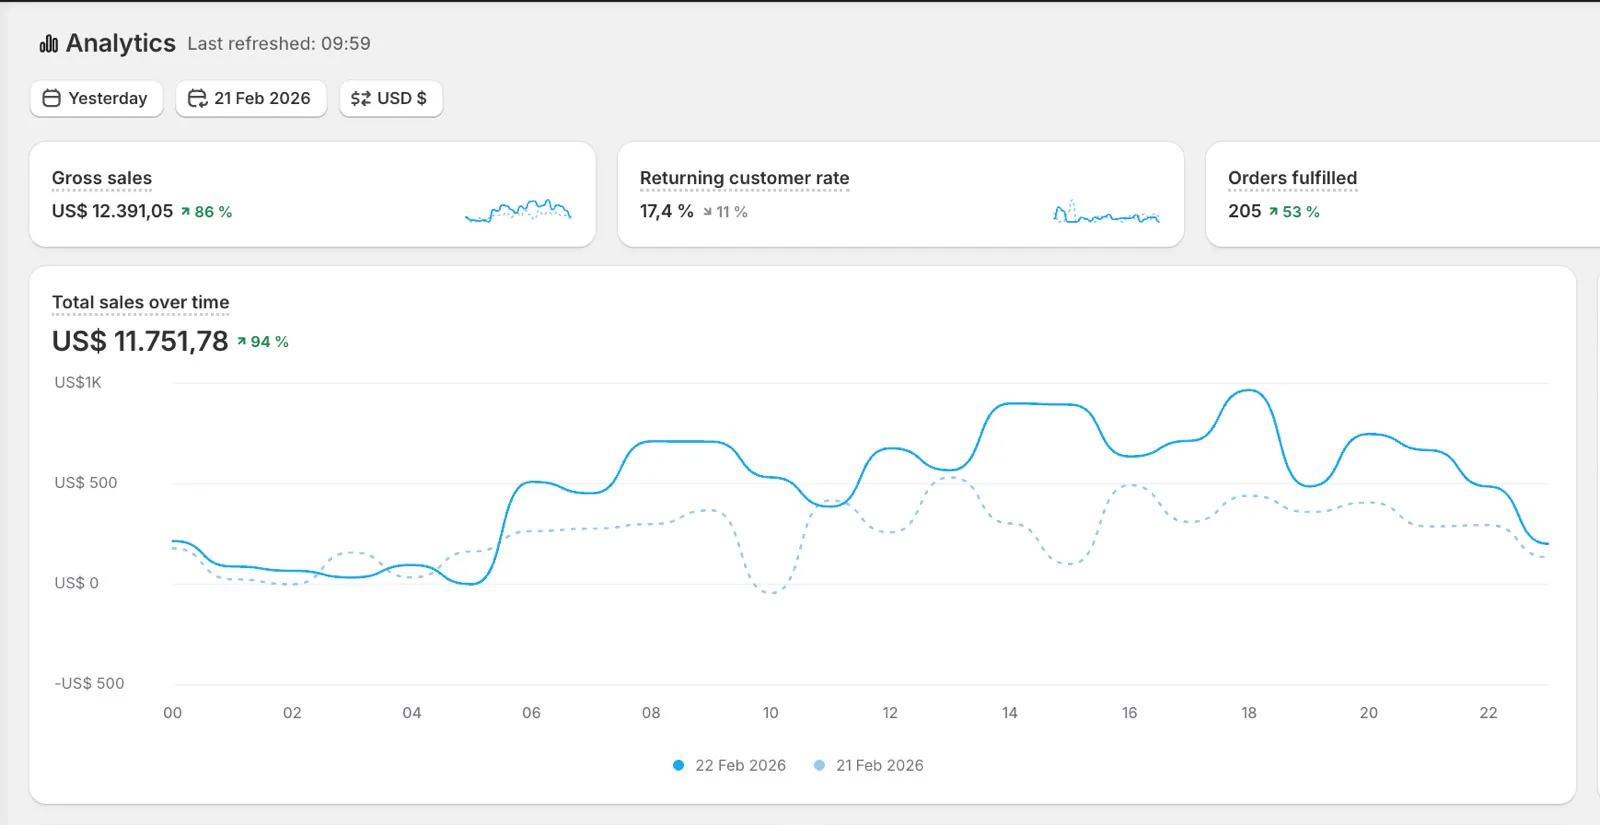
DTC ScaledScaled fulfilment and retention alongside paid acquisition on this store, built through the same test, validate, and launch model as every brand in the portfolio.
$12,391 in gross sales in a single day, up 86%, with 205 orders fulfilled and a 17.4% returning customer rate, now scaling under client ownership.
 Scaled
Shopify Portfolio 05
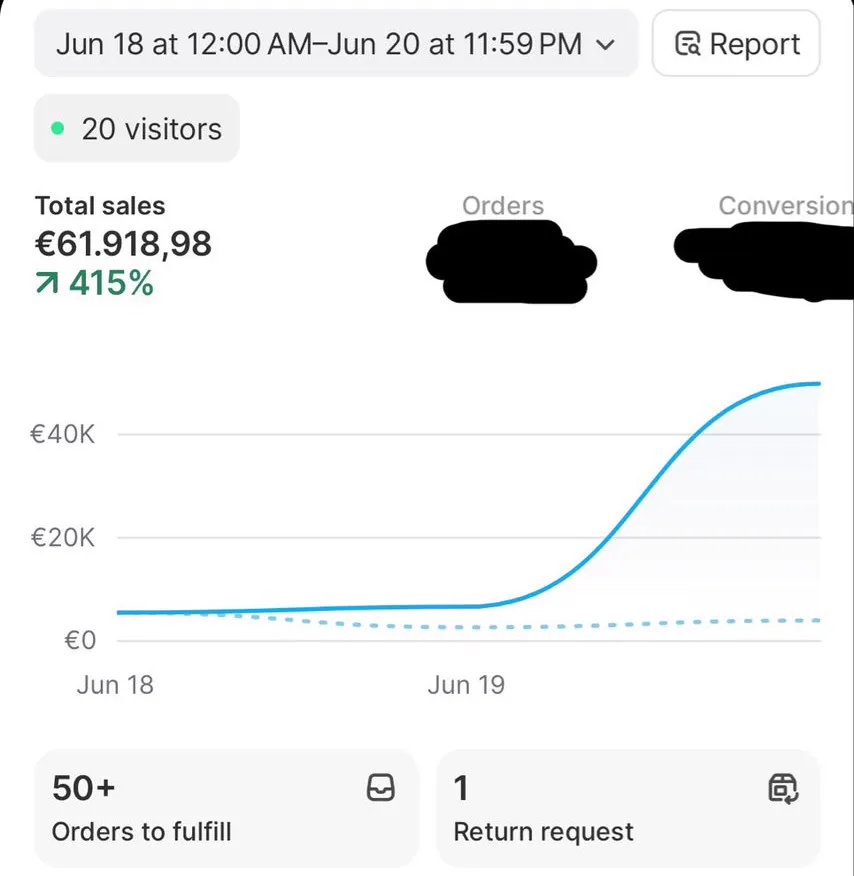
DTC ScaledRode a demand spike on this store after validating the offer under our standard test, validate, and launch model, then pushed spend to capture it.
€61,918.98 in sales across a single 3-day window, up 415%, with 50+ orders queued for fulfilment, now scaling under client ownership.
 Launched
Shopify Portfolio 06
DTC LaunchLaunched and validated under our standard test, validate, and launch model, converting early visitor traffic into consistent daily orders.
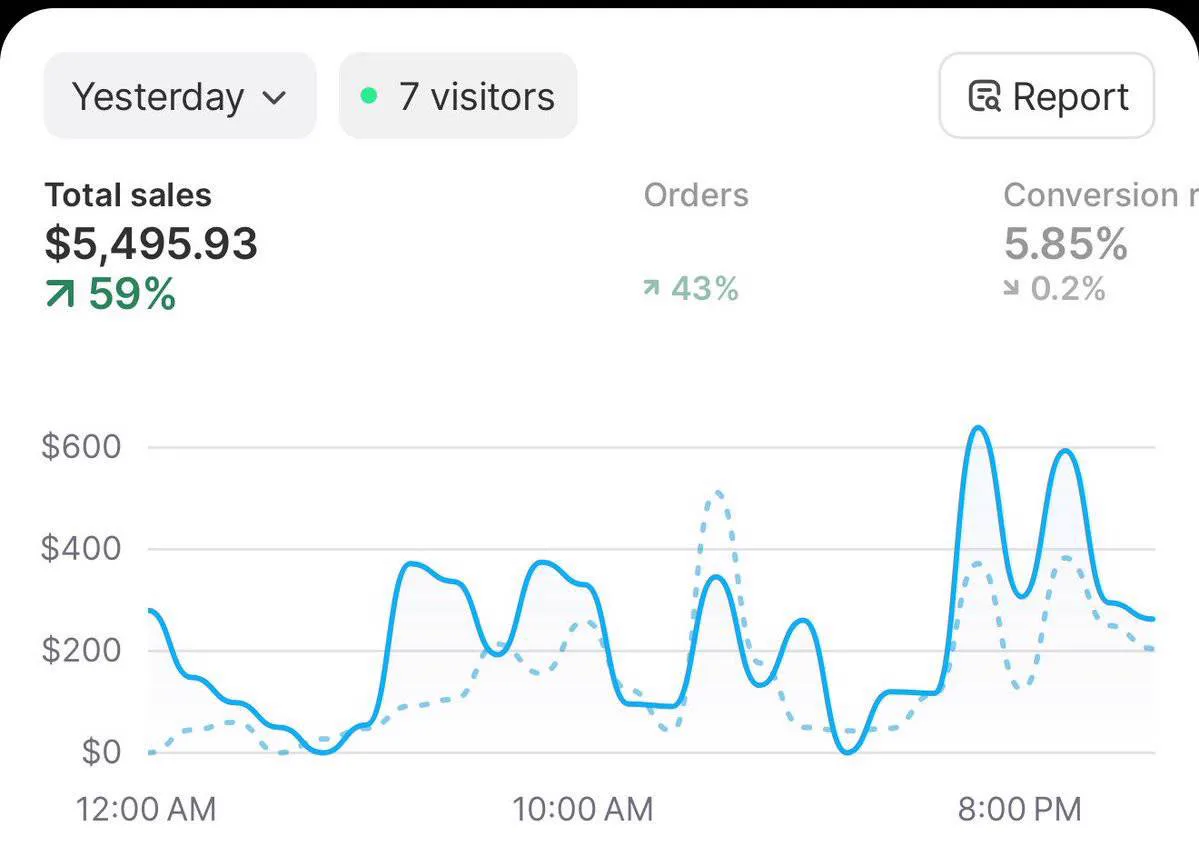
$5,495.93 in sales yesterday, up 59% day over day at a 5.85% conversion rate, now scaling under client ownership.
 Scaled
Shopify Portfolio 07
DTC ScaledTook this brand from a validated small-scale offer to a seven-figure monthly run rate using the same test, validate, and launch model applied across the whole portfolio.
$7,261,201 in sales over the last 30 days on $2,620,248 in ad spend, now scaling further under client ownership.
 Scaling
Shopify Portfolio 08
DTC ScaledWent from a validated test launch to a consistent seven-week scaling run, following the same test, validate, and launch model as every brand we build.
$154,751 in sales over a seven-week window with $43,258 in net profit at a 28% net margin and 2.82x ROAS, now scaling under client ownership.
TikTok Shop
5 brandsCreator engines and GMV Max programs that turn short form content into shop revenue.
 Scaled
TikTok Portfolio 01
TikTok ShopLaunched under the same test, validate, and launch model we run on every store, then scaled creator content and GMV Max once the offer was proven.
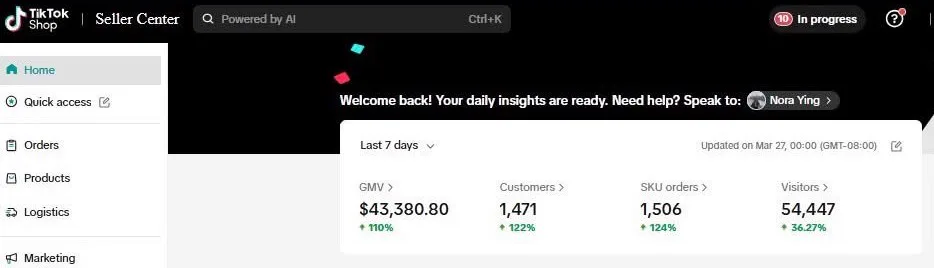
$43,380.80 in GMV over the last 7 days, up 110%, with 1,471 customers and 54,447 visitors, now scaling under client ownership.
 Scaled
TikTok Portfolio 02
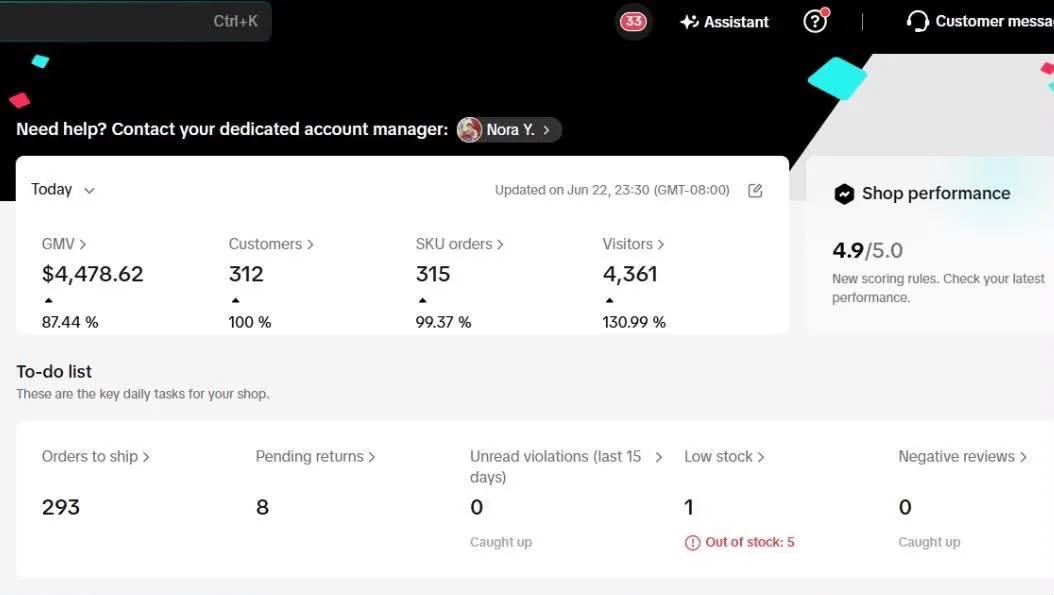
TikTok ShopRuns on the same test, validate, and launch model as every brand we build, now operating at scale with 293 orders shipping and a near-perfect shop score.
$4,478.62 in GMV today, up 87.4%, with 312 customers, a 4.9/5.0 shop rating, and zero negative reviews, now scaling under client ownership.
 Scaling
TikTok Portfolio 03
TikTok ShopValidated the offer first, then pushed creator volume and paid amplification under the same test, validate, and launch model across the portfolio.
$21,380.84 in GMV over the last 28 days, up 276%, with customers up 183% and visitors up 679%, now scaling under client ownership.
 Scaled
TikTok Portfolio 04
TikTok ShopBuilt a creator and affiliate engine on top of the same test, validate, and launch model, turning consistent video output into compounding GMV.
$110.67K in total shop GMV and $98.91K in affiliate GMV over the trailing month, with 1.99K videos posted and 6.51M video views, now scaling under client ownership.
 Scaled
TikTok Portfolio 05
TikTok ShopScaled past the initial validation phase of our test, validate, and launch model into a consistent multi-month run across GMV and order volume.
$132,076.14 in GMV on 2,942 orders and 3,215 items sold over the tracked window, now scaling under client ownership.
Stop Watching Volatility. Start Compounding It.
Applications are reviewed within 48 hours. Before you fill anything in, we would rather you read the risk disclosure and the full fee structure. Both are public, and neither requires a form.
Everything You Need.
Nothing You Don't.
- 20–30% target net return on your own capital, modelled and disclosed openly
- 100% equity ownership. Your entity, your name, your control.
- 36–60 month horizon to first exit conversation, not 7–10 years
- Real-time reporting dashboard access from day one
- A named operating consultant, not a call centre
- Priority scheduling for new brand builds
We're an independent consulting operation, not a fund manager, and we'd rather introduce ourselves properly than hide behind a marketing quote. Full founder bios, track record, and photos are being finalised for the Due Diligence page. Ask us directly and we'll walk you through our background on a call, before you commit to anything.
We onboard only as many partnerships as the current team can operate properly. Growing brand count faster than the people running them is the most documented cause of failure in this sector. Ask us for the per-partnership resourcing plan before you commit.