Case Studies & Verified Results
Real Results. Built By Our Team.
Below are verified Amazon portfolio results from active client accounts managed by our team, alongside the billion-dollar brand blueprints that define how we build and scale every brand.
Every brand we build follows the same operating framework: validated demand, AI-native execution, full client ownership, and a clear exit path.
We Don't Invent. We Clone Proven Winners.
The Samwer Brothers (Oliver, Marc and Alexander) built a $3B+ empire (Rocket Internet) without inventing a single product. Their method: identify a proven US digital business, clone the model with surgical precision, execute faster in new markets.
They cloned eBay → Alando (sold to eBay for $43M in 100 days). They cloned Airbnb → Wimdu. They cloned Zappos → Zalando (IPO'd at €5.7B). Not by being smarter. By being methodical.
"We are not inventors. We are engineers of proven models."
The Rocket Internet Philosophy
AI-Validated Demand
Before a single dollar is spent, our AI stack analyses search volume, competitor ROAS, margin profiles, and customer LTV across 40+ data points. We only launch what the market already wants.
Clone Proven Brand Architectures
We reverse-engineer the top 1% of e-commerce brands: their positioning, creative angles, price points, and supply chains. Then rebuild with improvements. Every brand launches from a position of validated strength.
AI Accelerated Execution
Where the Samwers used speed of human execution, we deploy AI. Autonomous ad optimisation, AI copywriting, predictive inventory, and real-time margin management. Years of learning compressed into weeks.
Brands That Changed Everything
The billion-dollar playbooks we study when designing a launch.
Gymshark, MVMT, Beardbrand, and Allbirds are independent third parties. We did not found, fund, operate, or advise any of them, and we hold no interest in any of them. They are cited only as publicly documented examples of what this category has produced. Their outcomes are not our track record and predict nothing about results we can achieve. Our own operating data is in the section below, clearly separated.

Gymshark
From a garage to a billion-dollar empire. In 8 years.
Ben Francis started Gymshark in 2012 from his parents' garage in Birmingham with £1,000 and a screen-printing machine. He identified a gap: the market had no premium fitness apparel that actually fit athletic bodies. Rather than compete on price, he went direct-to-consumer via social media before it was a strategy. By 2020, General Atlantic invested at a £1 billion valuation with no traditional retail stores involved.
DTC via social media + influencer seeding. No retail stores. Pure digital brand velocity.
This is our model applied to apparel. Proven demand + digital-first execution + no legacy overhead = category dominance.

MVMT Watches
No factory. No store. A $300M exit in 4 years.
Jake Kassan and Kramer LaPlante launched MVMT in 2013 with $300,000 raised on Indiegogo. The insight was simple: fashion watches were massively overpriced by retail markups. By cutting out every middleman and selling direct, they offered premium aesthetics at a fraction of the cost. In 2018, Swiss luxury group Movado acquired MVMT for $300M. That is a 1,000x return on founding capital.
Crowdfunding-to-DTC pipeline. Facebook/Instagram as primary acquisition channel. SKU discipline with few, high-converting products.
Proof that a small, focused brand with tight SKUs and paid social can outperform legacy players 100x their size. Our model uses the same playbook, applied digitally.

Beardbrand
Built on YouTube. Profitable from Day 1.
Eric Bandholz launched Beardbrand in 2012 with $30 and a Tumblr blog. He understood that men's grooming had no premium digital-native brand. Using YouTube content marketing before content marketing had a name, he built an audience of 2 million subscribers and converted them into a loyal customer base. The brand was profitable within months and has never taken external capital, generating $7M+ in annual revenue with 80%+ margins on hero SKUs.
YouTube-first content engine. Zero ad spend in Year 1. Organic audience compounding. Subscription revenue for predictable base.
The "annuity" model made real: high-margin consumables + subscription = predictable, growing cash flows. This is what AI-powered brand management replicates at scale.

Allbirds
$50M crowdfunded. $1.4B IPO. One SKU.
Tim Brown and Joey Zwillinger launched Allbirds in 2016 with a radical concept: one shoe, made from wool, designed for simplicity. The entire first campaign was a single Kickstarter raising $120K in four days. By 2021 they IPO'd on NASDAQ at a $1.4 billion valuation. The insight was not sustainability. It was conviction. They believed one great product, marketed with a clear narrative, beats a hundred mediocre ones.
Kickstarter product validation → DTC brand building → retail adjacency. Single hero SKU then SKU expansion from position of strength.
Proof of the product conviction principle. We identify one validated product per brand, builds authority around it, then expands. Exactly this playbook, with AI-accelerated validation.
The Dashboards Behind The Brands We Build.
Live client accounts operated by our team across Amazon, Shopify, and TikTok Shop. Every screenshot below is taken unedited from the platform's own seller dashboard.
These are accounts our team runs, shown at account level and before portfolio-level fees are applied. Figures are platform-reported and are not independently audited unless expressly stated. Client identities are withheld at their request and can be verified under NDA, including by live screen-share rather than exported images. Strong periods are shown here; ask us for the full account list, including the ones that underperformed.
Amazon
7 brandsAccount launches, listing and PPC builds, and full turnarounds on Seller Central.
 Scaling
Portfolio Account 01
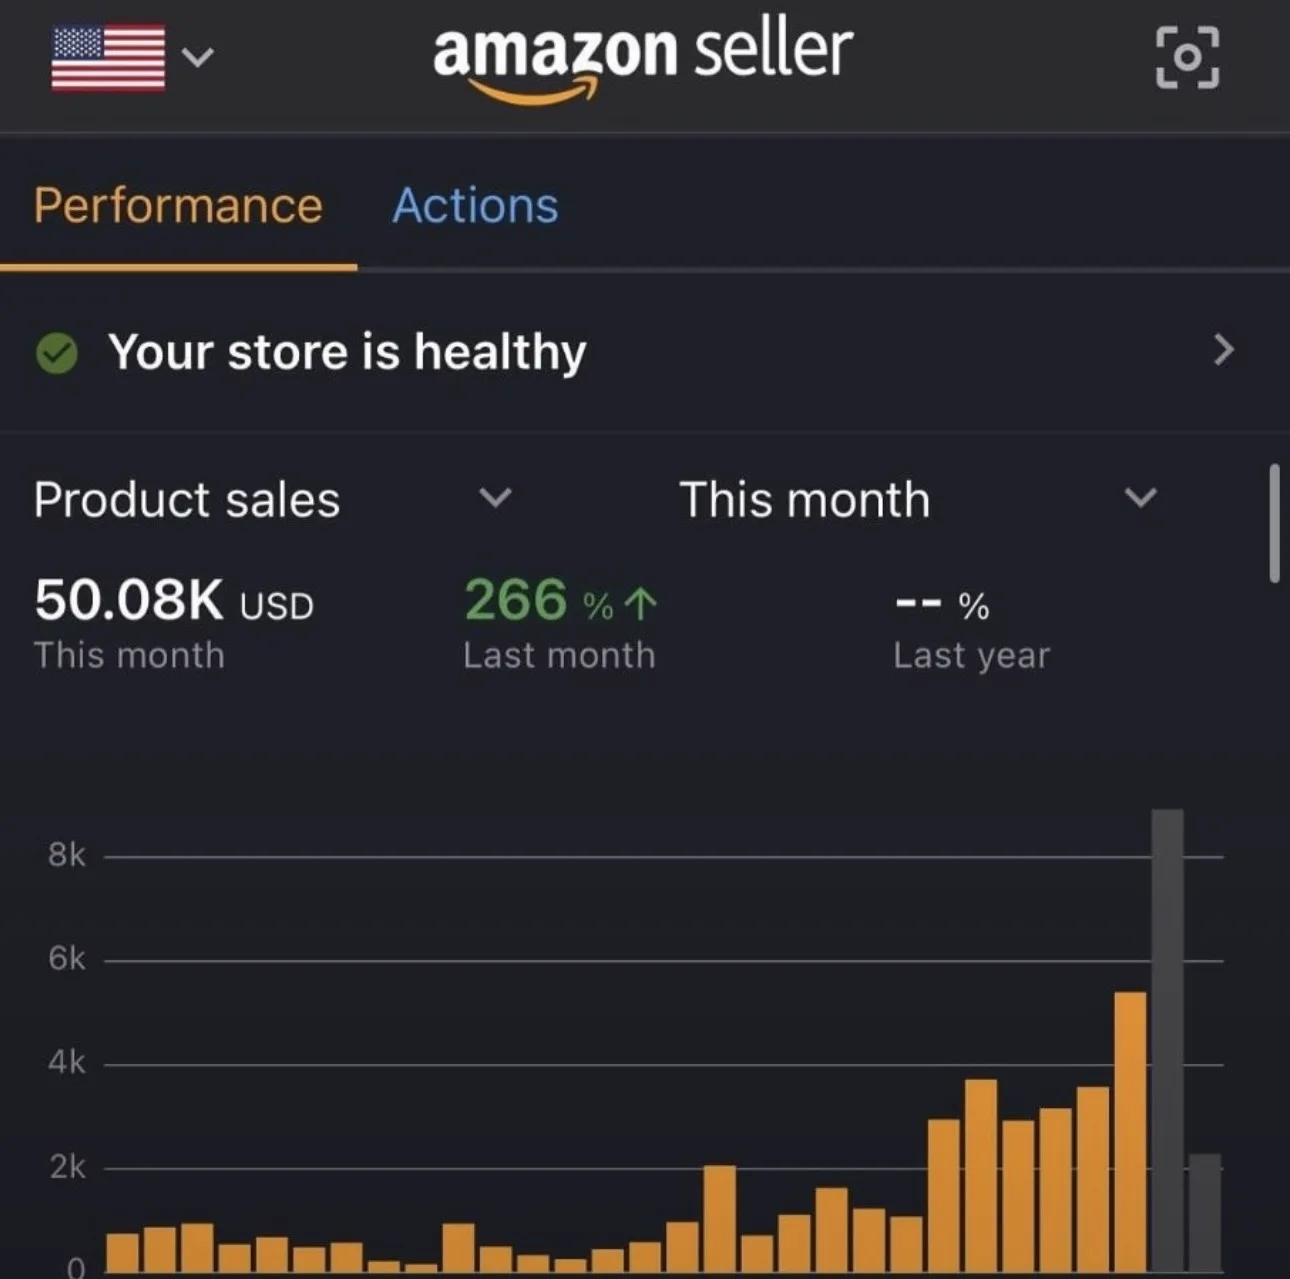
Amazon USARebuilt the PPC structure and listing set on a US Amazon account coming off a slow stretch, prioritising the highest-intent search terms first.
This month's sales already sit at $50.08K, up 266% over last month.
 Scaled
Portfolio Account 02
Amazon USATook a mature Amazon USA account through an aggressive PPC and catalog expansion push to capture demand ahead of peak season.
$543.5K in sales over the last 30 days, up 337% on the prior period and 204% year over year.
 Scaled
Portfolio Account 03
Amazon USAManaged full-funnel advertising and listing optimisation on a consistently performing Amazon USA account, compounding growth month over month.
$150.0K in sales over the last 30 days, up 21% on the prior period and 183% year over year, with 415 units moving on a single day inside the window.
 Scaled
Portfolio Account 04
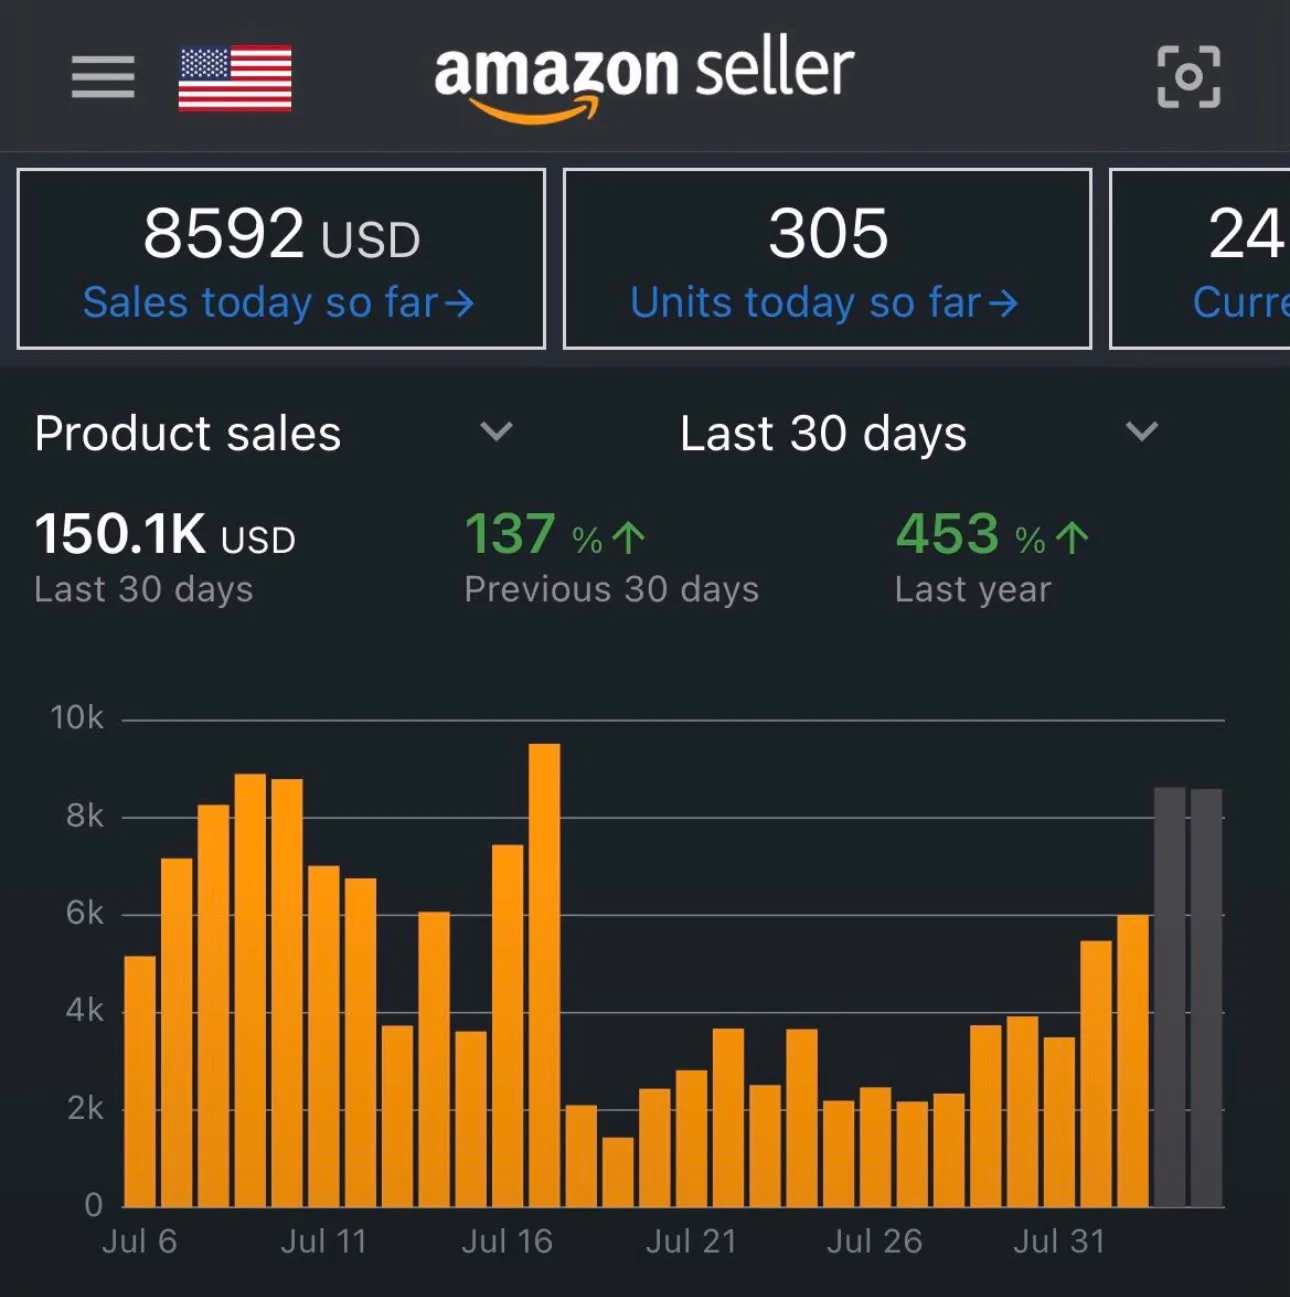
Amazon USARan a summer push across advertising and inventory planning on a US Amazon account, converting seasonal demand into sustained order volume.
$150.1K in sales over the last 30 days, up 137% on the prior period and 453% year over year.
 Scaling
Portfolio Account 05
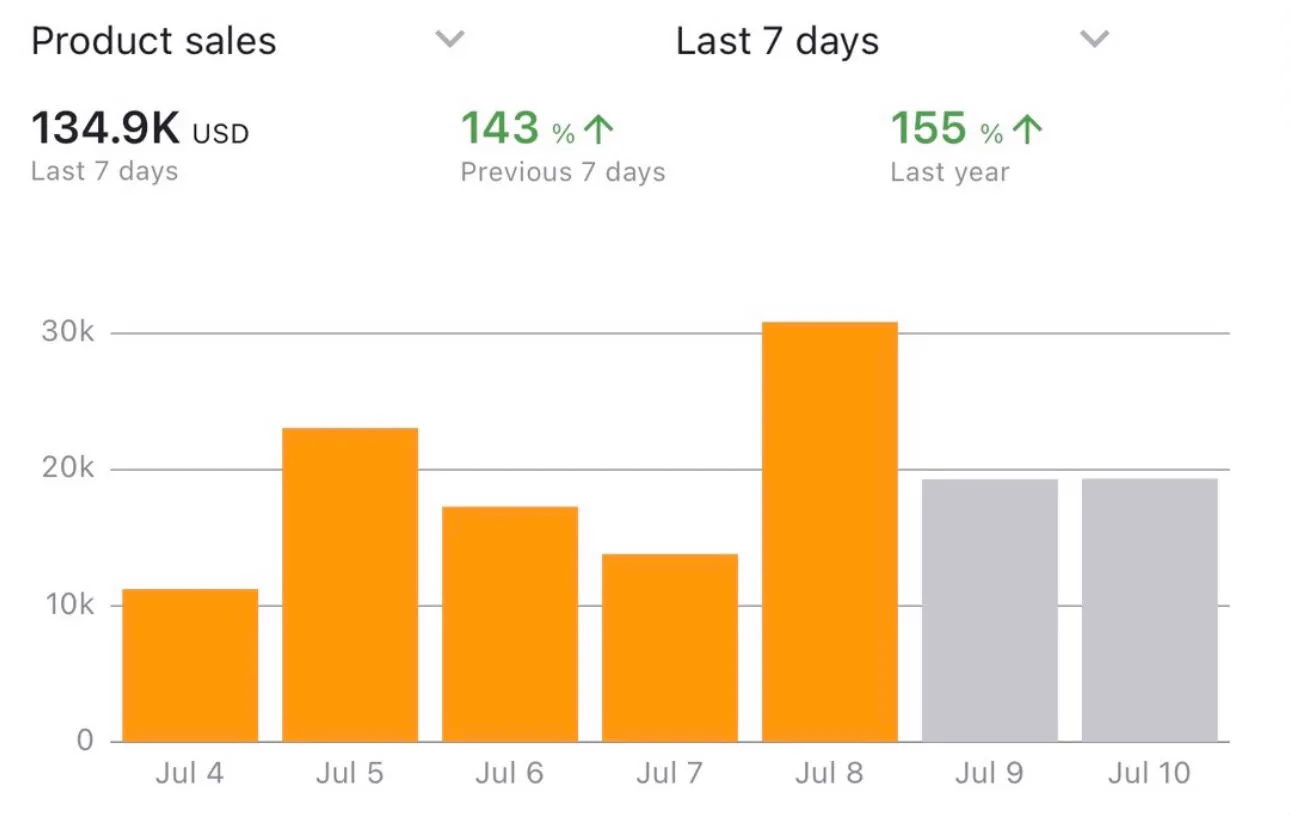
Amazon USACompressed a seasonal advertising push into a single week on this Amazon USA account, timing spend around a proven demand spike.
$134.9K in sales over the last 7 days alone, up 143% week over week and 155% year over year.
 Managed
Portfolio Account 06
Amazon USAHandled full account operations for the month, from order fulfilment through refund management, on an established Amazon USA account.
Closed the month at $174,442 in sales across 3,644 orders, with $109.4K in estimated payout and $29.3K in gross profit after refunds.
 Scaled
Portfolio Account 07
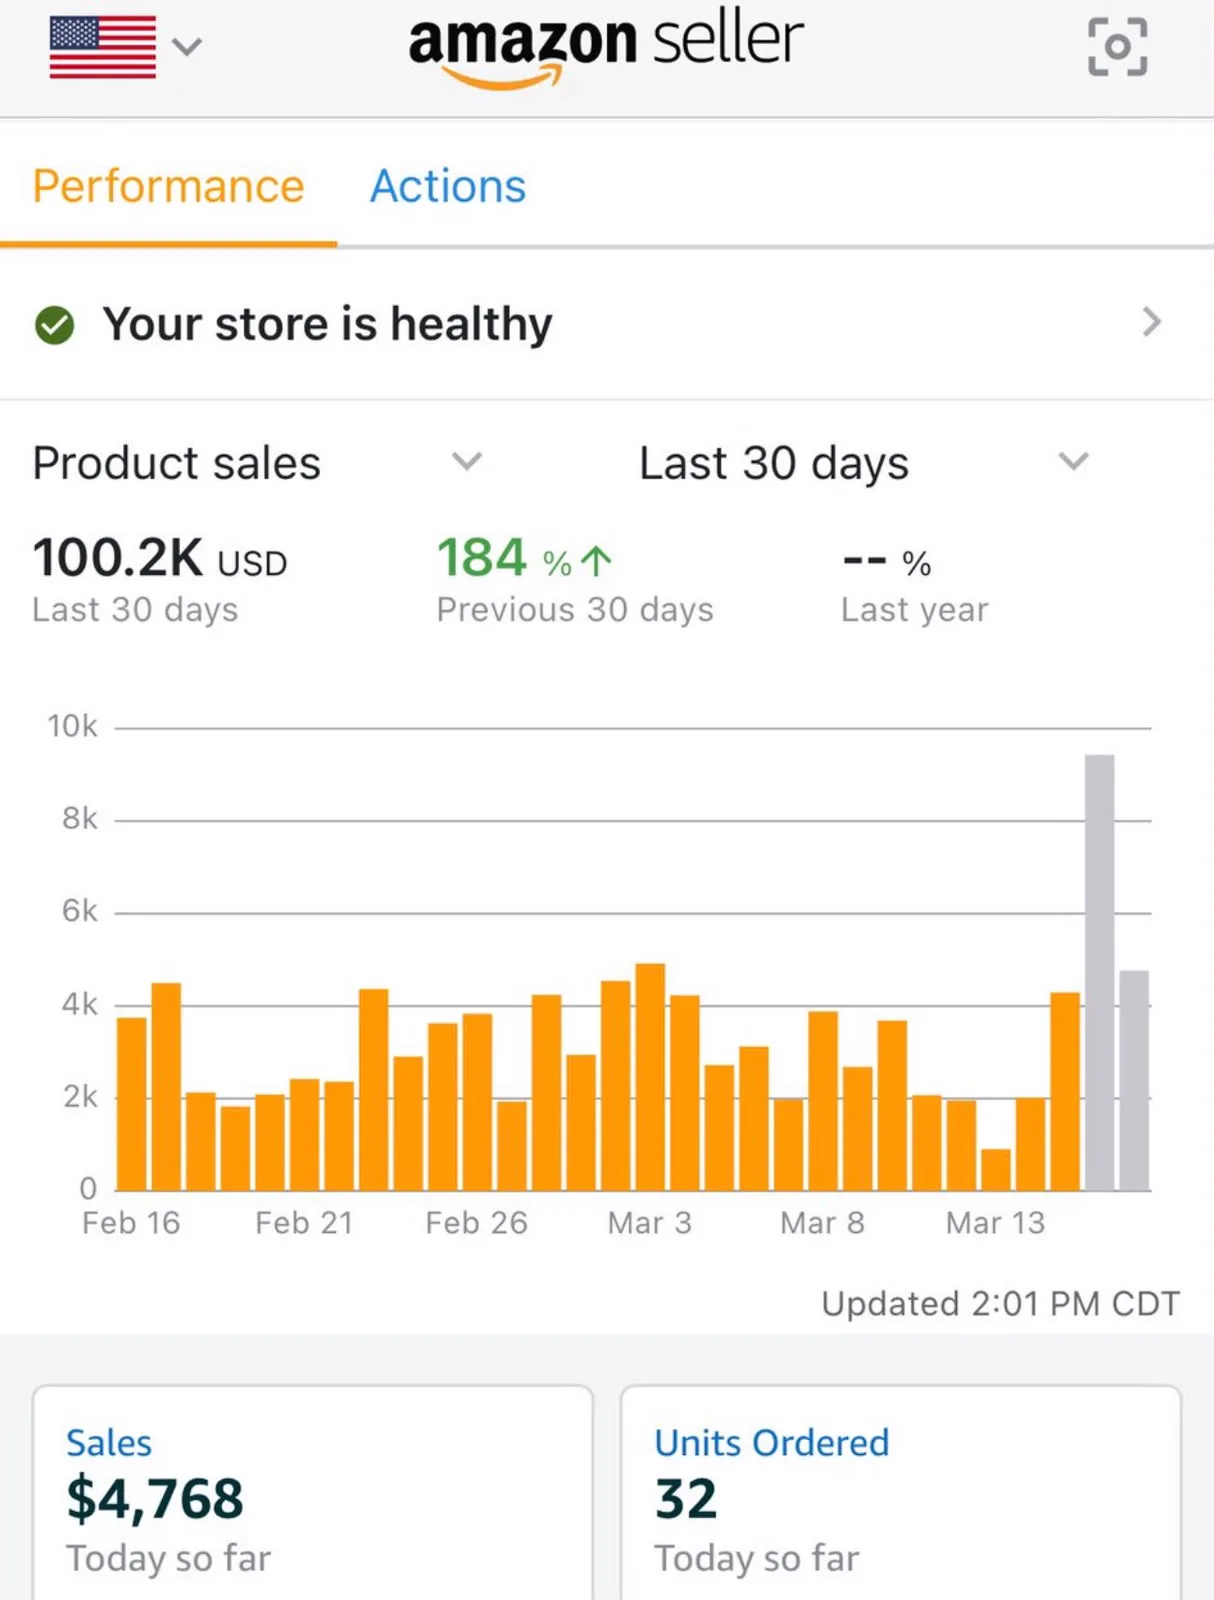
Amazon USARebuilt advertising structure and pricing strategy on this Amazon USA account, holding a healthy store status while scaling spend.
$100.2K in sales over the last 30 days, up 184% on the prior period, with $4,768 in sales and 32 units ordered today alone.
Shopify
8 brandsDirect to consumer stores built and scaled with paid social, email, and conversion work.
 Launched
Shopify Portfolio 01
DTC LaunchLaunched on the same test, validate, and launch model we run every store on, going live and crossing its first 10 orders inside the first stretch.
kr13,109 in sales yesterday alone, up 56% day over day with orders up 37%, now scaling under client ownership.
 Scaled
Shopify Portfolio 02
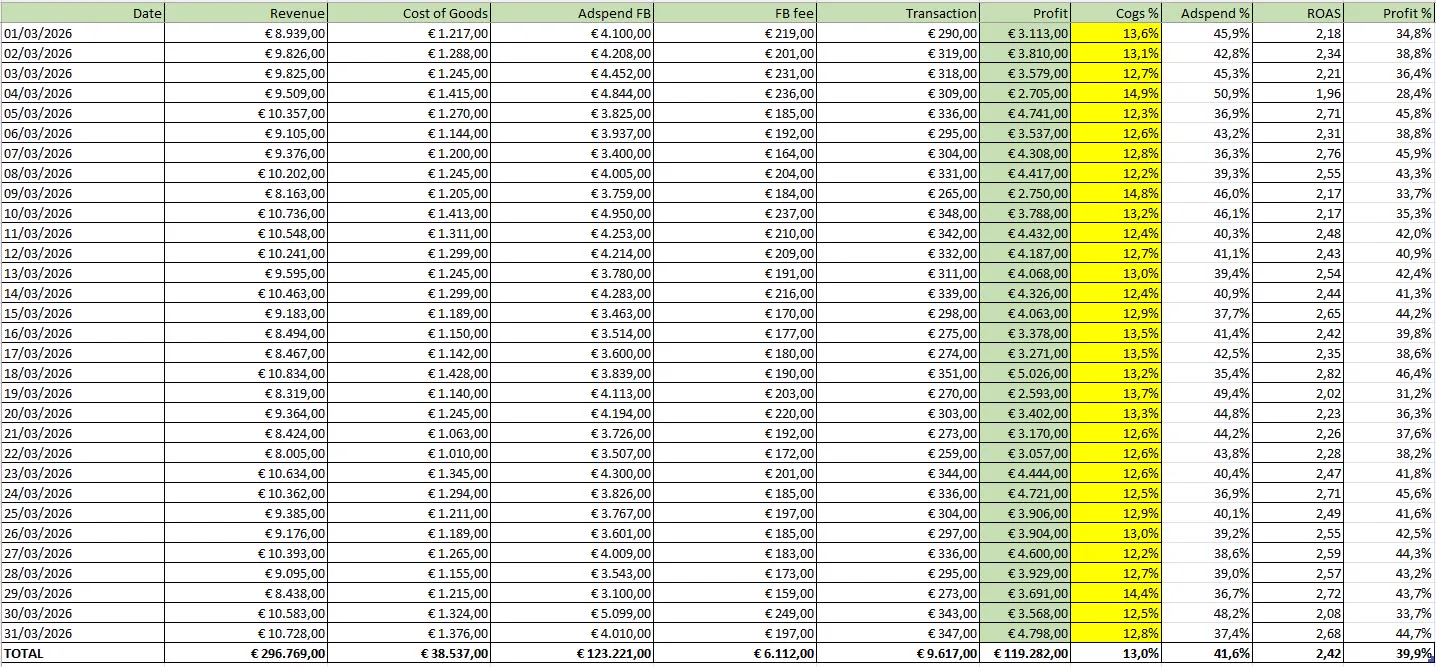
DTC ScaledValidated the offer, then scaled paid social spend month over month once margins held, using the same test, validate, and launch model across every brand we build.
€296,769 in revenue for the month with €119,282 in profit at a 39.9% margin and a 2.42x return on ad spend, now scaling under client ownership.
 Launched
Shopify Portfolio 03
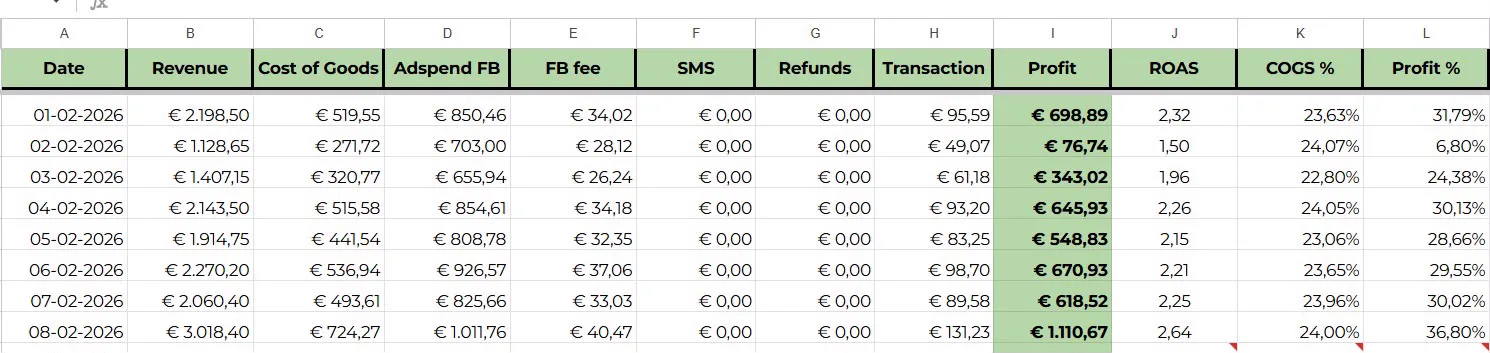
DTC LaunchEarly-stage launch under the same test, validate, and launch model, tracking daily profit and ROAS from day one to confirm the offer before scaling spend.
Already profitable within the first week, holding a 2.64x ROAS and 24%+ margins by day 8, now scaling under client ownership.
 Scaled
Shopify Portfolio 04
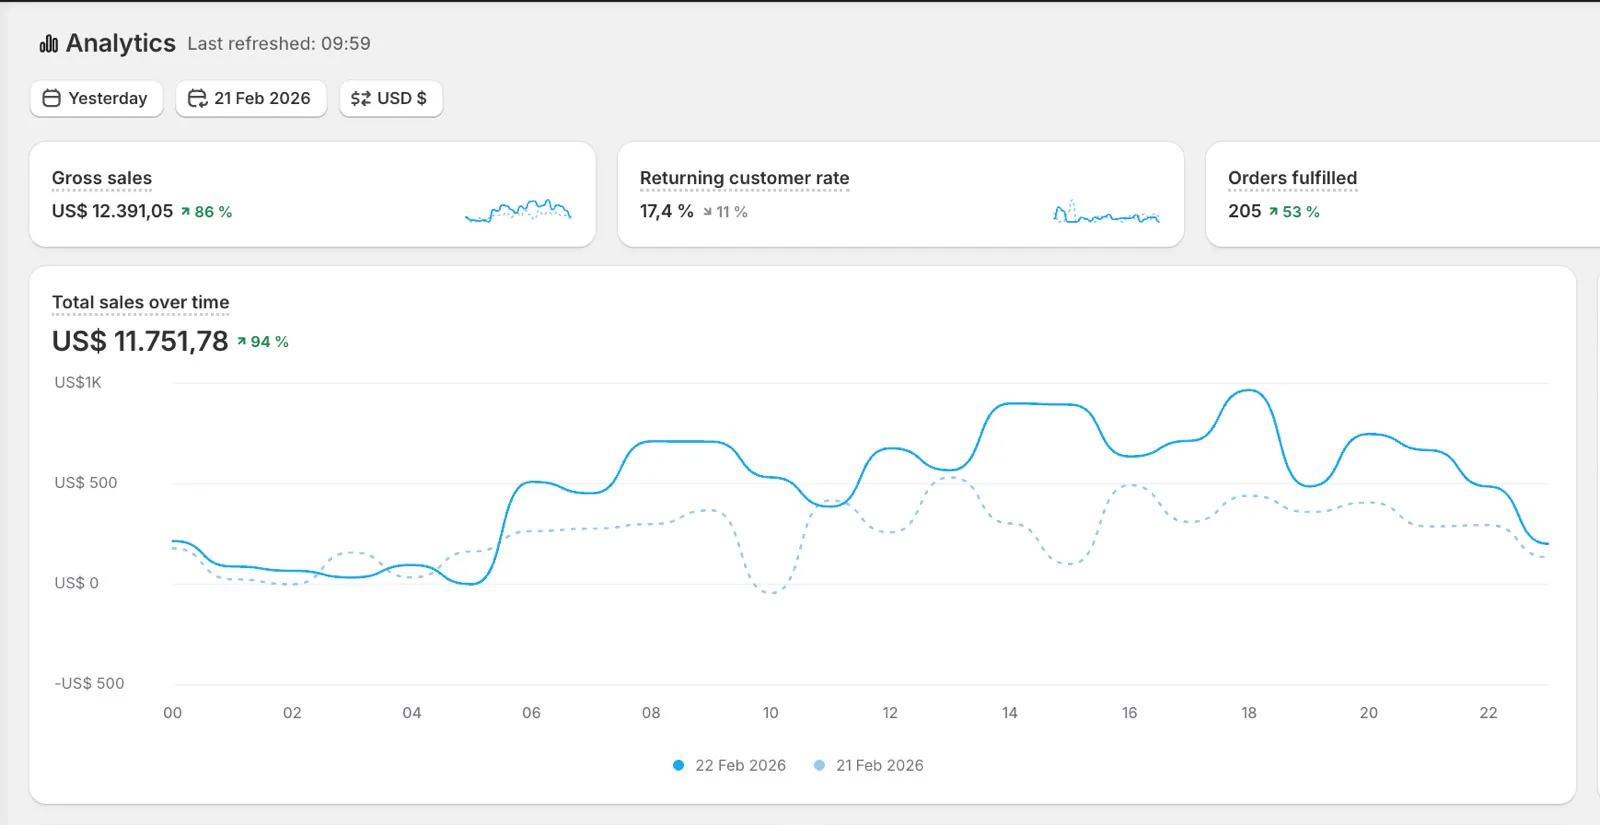
DTC ScaledScaled fulfilment and retention alongside paid acquisition on this store, built through the same test, validate, and launch model as every brand in the portfolio.
$12,391 in gross sales in a single day, up 86%, with 205 orders fulfilled and a 17.4% returning customer rate, now scaling under client ownership.
 Scaled
Shopify Portfolio 05
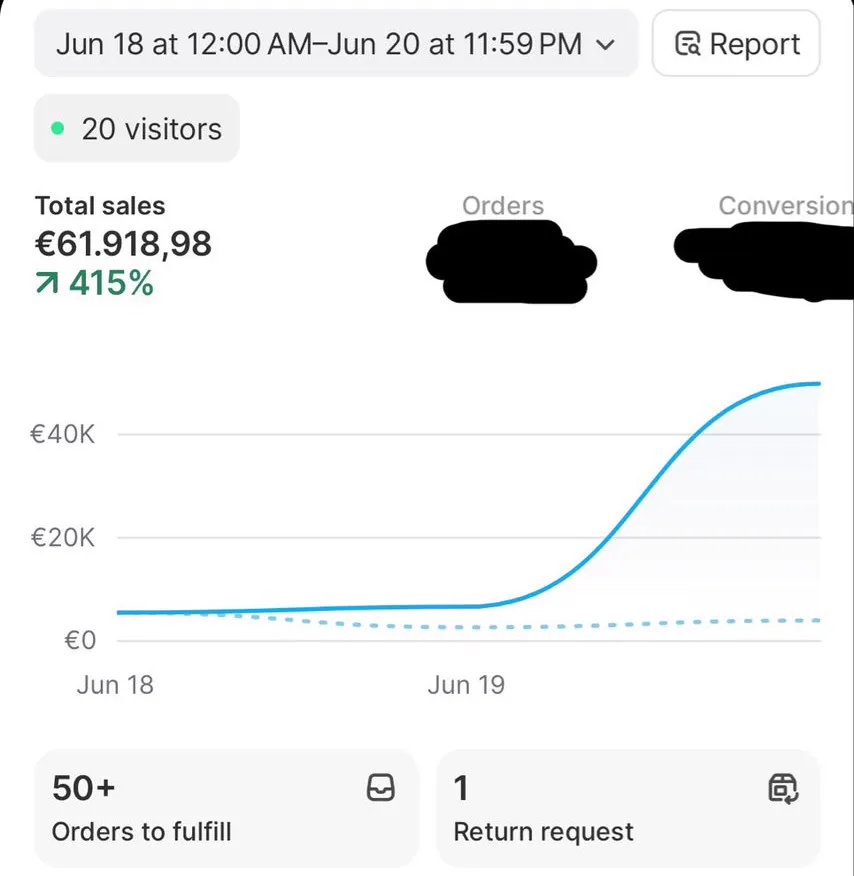
DTC ScaledRode a demand spike on this store after validating the offer under our standard test, validate, and launch model, then pushed spend to capture it.
€61,918.98 in sales across a single 3-day window, up 415%, with 50+ orders queued for fulfilment, now scaling under client ownership.
 Launched
Shopify Portfolio 06
DTC LaunchLaunched and validated under our standard test, validate, and launch model, converting early visitor traffic into consistent daily orders.
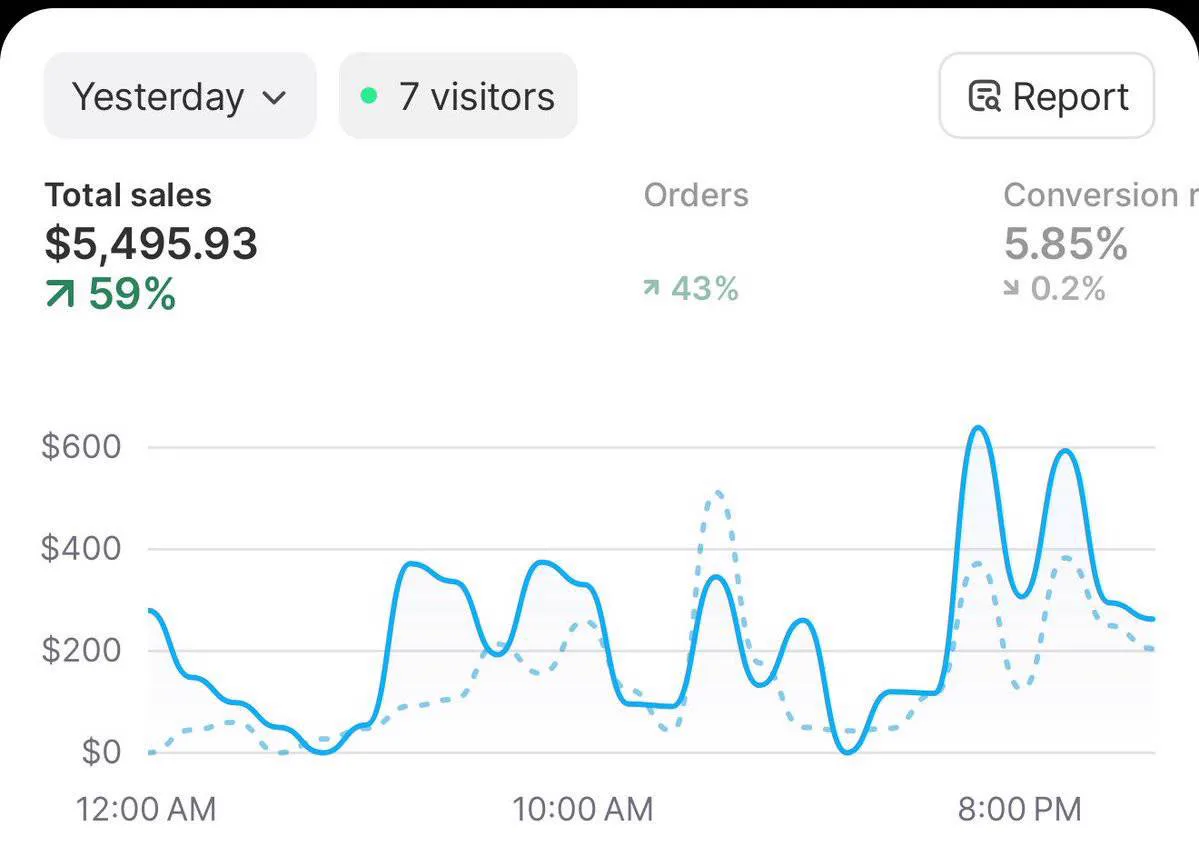
$5,495.93 in sales yesterday, up 59% day over day at a 5.85% conversion rate, now scaling under client ownership.
 Scaled
Shopify Portfolio 07
DTC ScaledTook this brand from a validated small-scale offer to a seven-figure monthly run rate using the same test, validate, and launch model applied across the whole portfolio.
$7,261,201 in sales over the last 30 days on $2,620,248 in ad spend, now scaling further under client ownership.
 Scaling
Shopify Portfolio 08
DTC ScaledWent from a validated test launch to a consistent seven-week scaling run, following the same test, validate, and launch model as every brand we build.
$154,751 in sales over a seven-week window with $43,258 in net profit at a 28% net margin and 2.82x ROAS, now scaling under client ownership.
TikTok Shop
5 brandsCreator engines and GMV Max programs that turn short form content into shop revenue.
 Scaled
TikTok Portfolio 01
TikTok ShopLaunched under the same test, validate, and launch model we run on every store, then scaled creator content and GMV Max once the offer was proven.
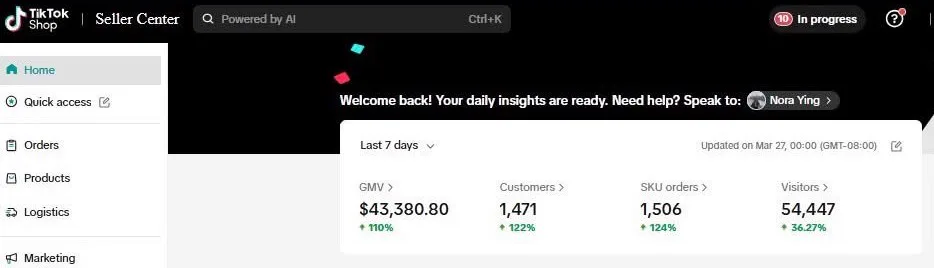
$43,380.80 in GMV over the last 7 days, up 110%, with 1,471 customers and 54,447 visitors, now scaling under client ownership.
 Scaled
TikTok Portfolio 02
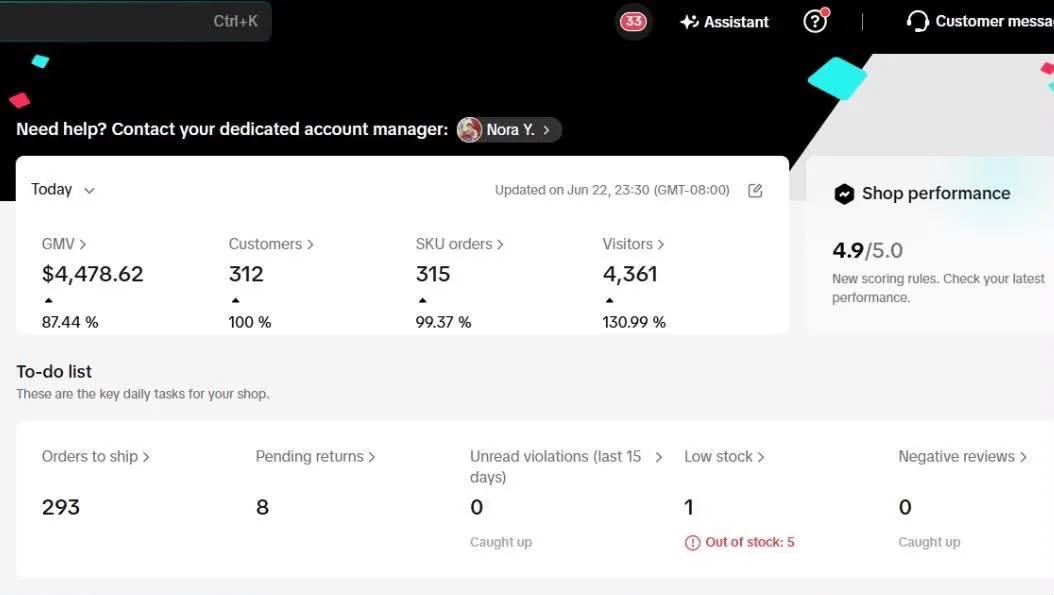
TikTok ShopRuns on the same test, validate, and launch model as every brand we build, now operating at scale with 293 orders shipping and a near-perfect shop score.
$4,478.62 in GMV today, up 87.4%, with 312 customers, a 4.9/5.0 shop rating, and zero negative reviews, now scaling under client ownership.
 Scaling
TikTok Portfolio 03
TikTok ShopValidated the offer first, then pushed creator volume and paid amplification under the same test, validate, and launch model across the portfolio.
$21,380.84 in GMV over the last 28 days, up 276%, with customers up 183% and visitors up 679%, now scaling under client ownership.
 Scaled
TikTok Portfolio 04
TikTok ShopBuilt a creator and affiliate engine on top of the same test, validate, and launch model, turning consistent video output into compounding GMV.
$110.67K in total shop GMV and $98.91K in affiliate GMV over the trailing month, with 1.99K videos posted and 6.51M video views, now scaling under client ownership.
 Scaled
TikTok Portfolio 05
TikTok ShopScaled past the initial validation phase of our test, validate, and launch model into a consistent multi-month run across GMV and order volume.
$132,076.14 in GMV on 2,942 orders and 3,215 items sold over the tracked window, now scaling under client ownership.